345,00 € – 1.195,00 €
Product details
Synonyms = Anoctamin 1; Calcium Activated Chloride Channel; Discovered On Gastrointestinal Stromal Tumors Protein 1; TAOS2; ORAOV2; TMEM16A
Antibody type = mouse monoclonal / IgG1
Clone = MSVA-201M
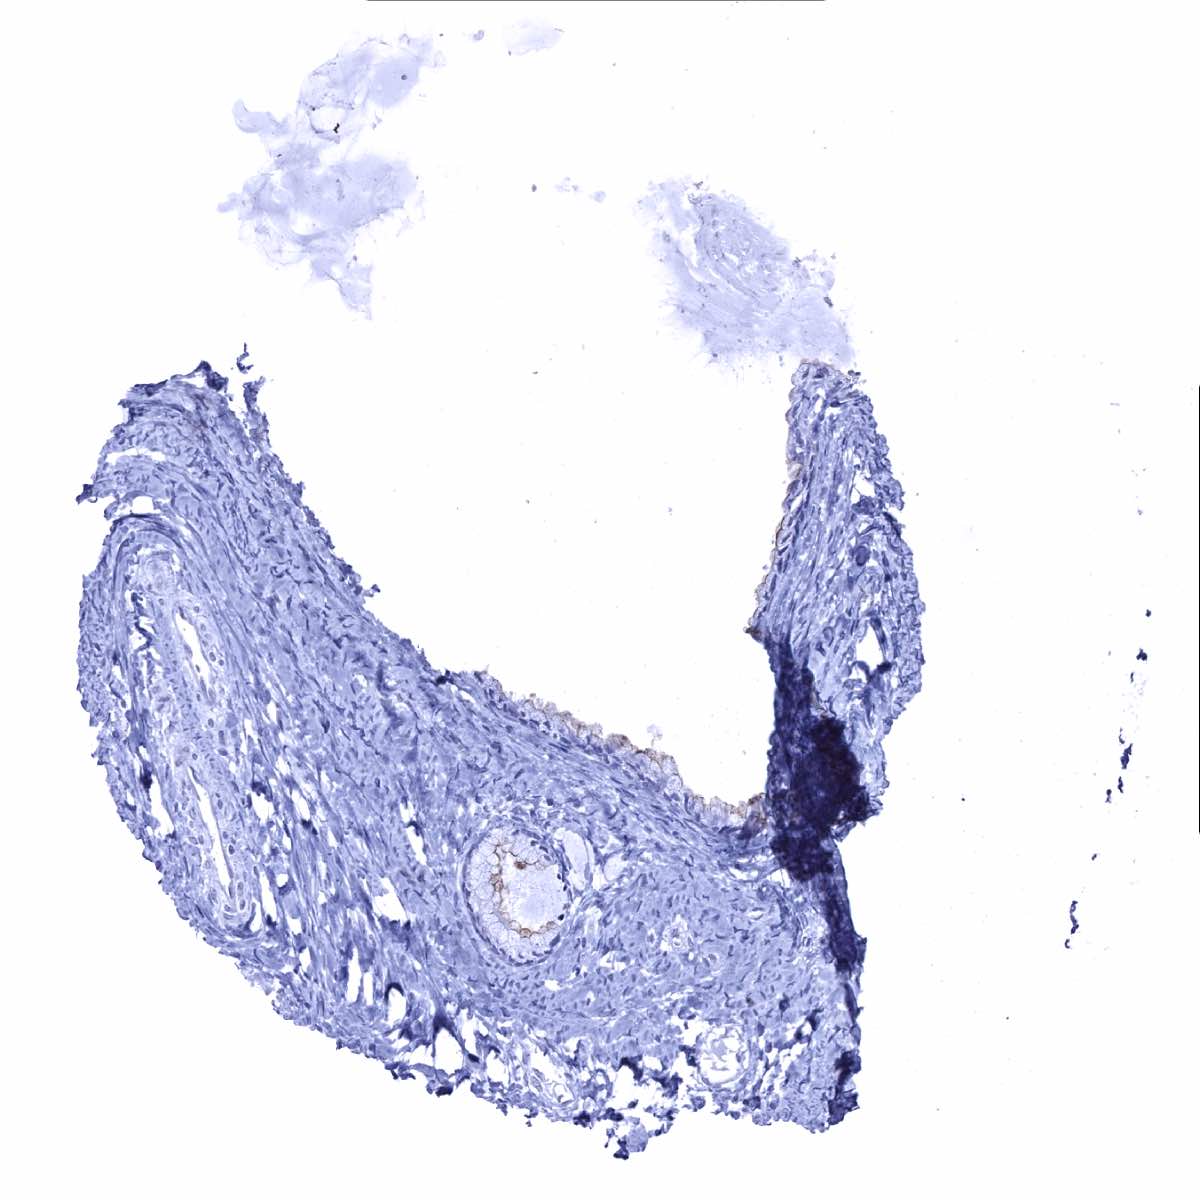
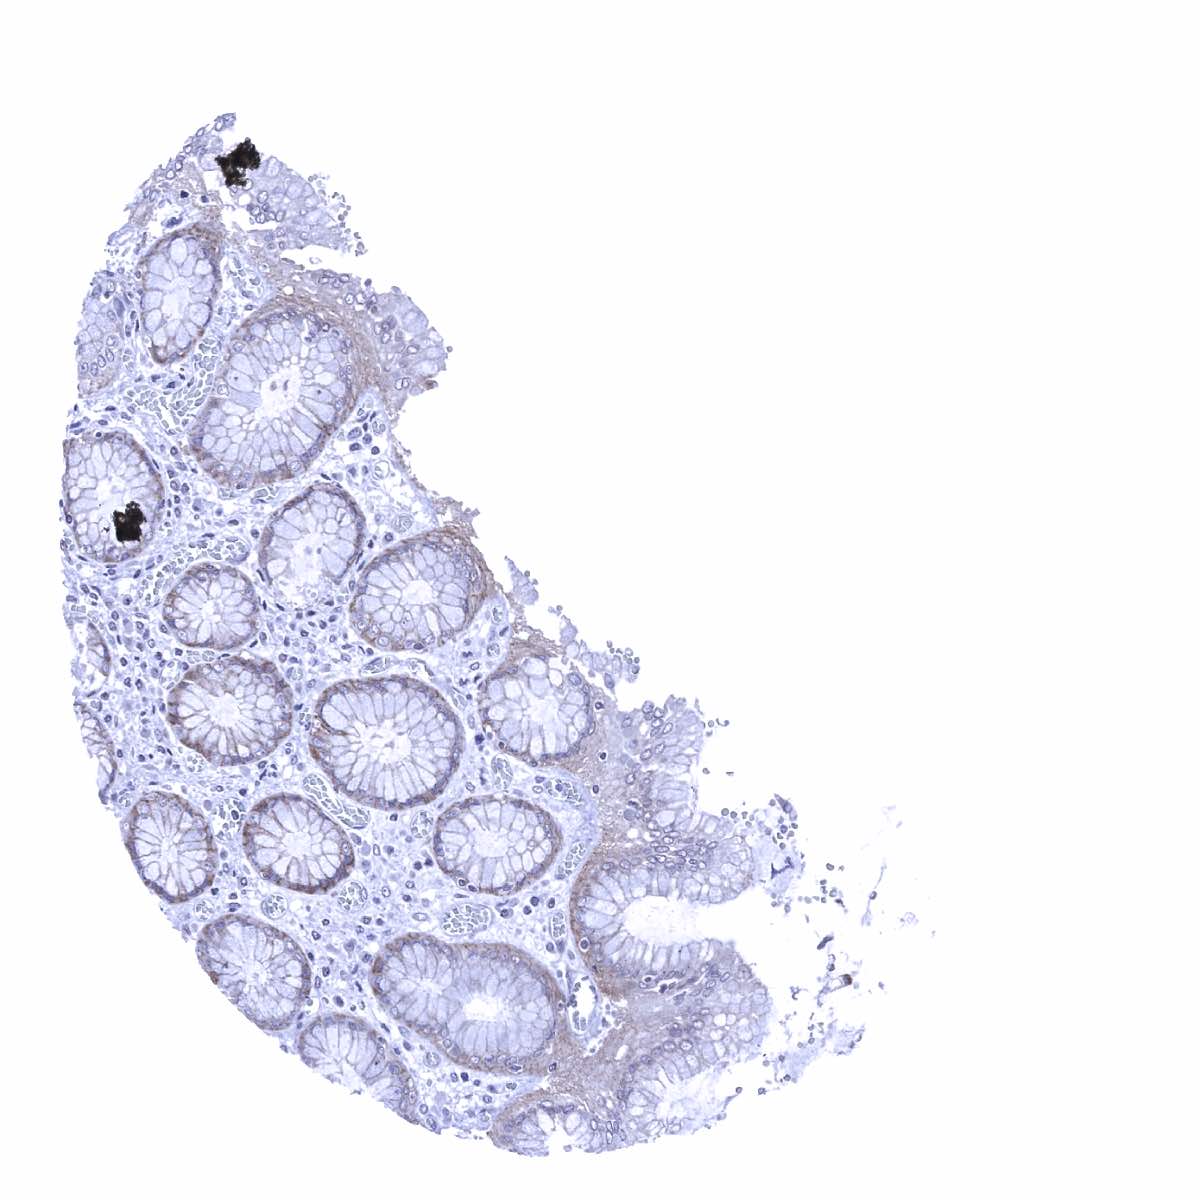
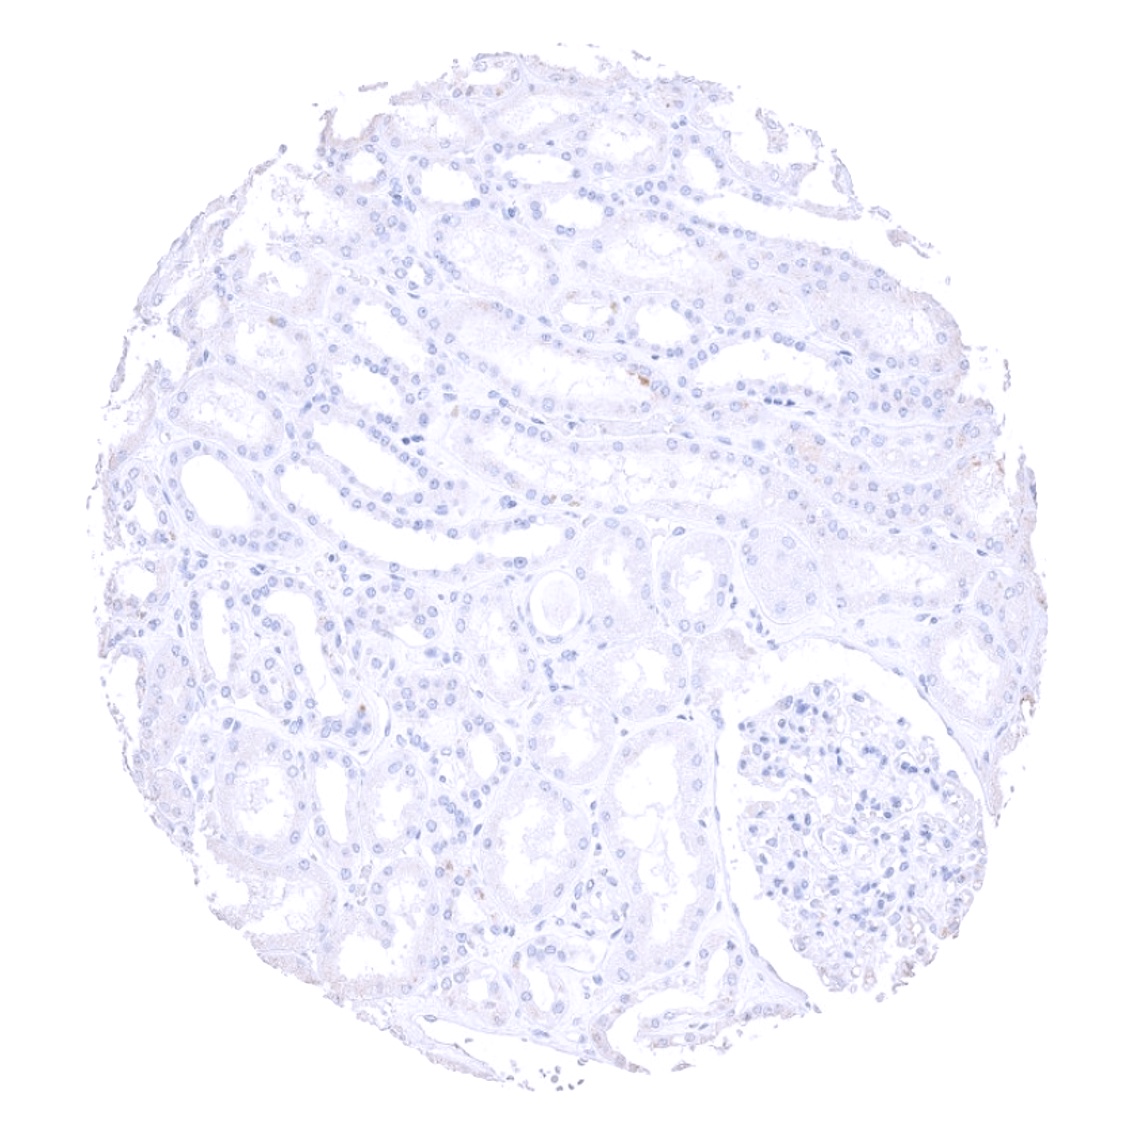
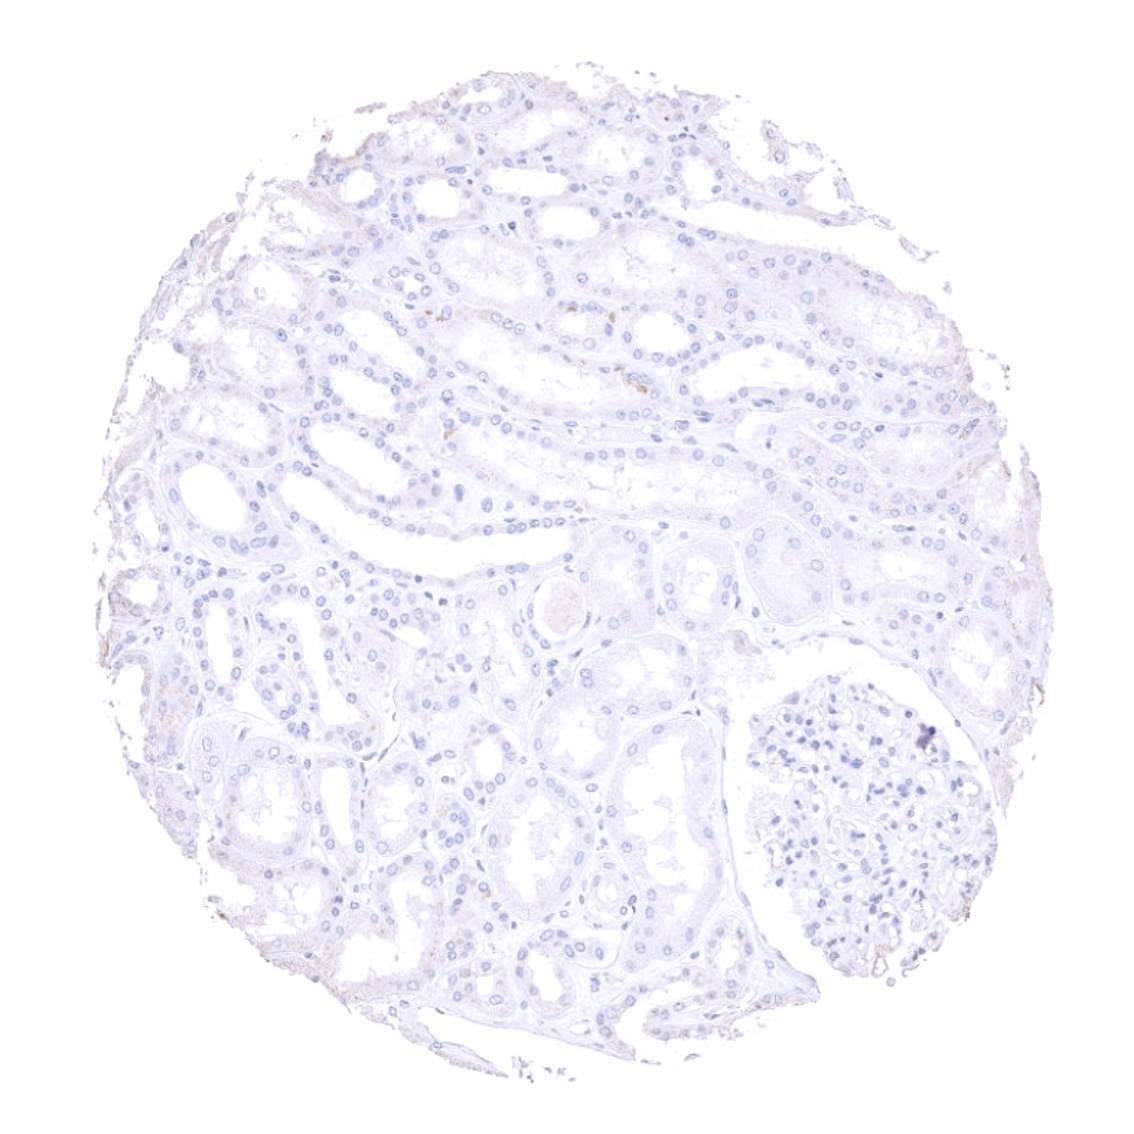
Positive control = Appendix: An at least moderate, predominantly membranous staining should be seen in Cajal cells in the muscular wall and a weak membranous staining should be seen in columnar epithelial cells in the basal part of the crypts of the appendix.
Negative control = Appendix: Staining should be absent in the majority of cells in the muscular wall and in epithelial cells located at the surface.
Cellular localization = Cell Surface and Cytoplasm
Reactivity = Human
Application = Immunohistochemistry
Dilution = 1:100 – 1:200
Intended Use = Research Use Only
Relevance of Antibody
Biology Behind
DOG1 (Discovered on GIST1) was named after its discovery in gastrointestinal stroma tumors (GIST). The 111 KDa DOG1 protein (syn. TMEM16A, Anoctamin-1) is encoded by the ANO1 gene located at 11q13 and acts as a voltage-gated calcium-activated chloride and bicarbonate channel. In human tissues, DOG1 is normally expressed by the gastrointestinal interstitial cells of Cajal where it triggers epithelial chloride secretion that is required for intestinal motility. As the cells of Cajal give rise to gastrointestinal stroma tumors, retained expression of DOG1 is an important diagnostic feature of this tumor type. DOG1 exerts a direct impact on tumor growth in cancers through its regulation of EGFR signaling and pathway modulators like MAPK and protein kinase B. ANO1 blockers like niflumic acid have been shown to block slow waves, which produce motility, in the human intestine. [1]
[1] Jansen et al. “DOG1 is commonly expressed in pancreatic adenocarcinoma but unrelated to cancer aggressiveness”PeerJ: 2021; 9: e11905
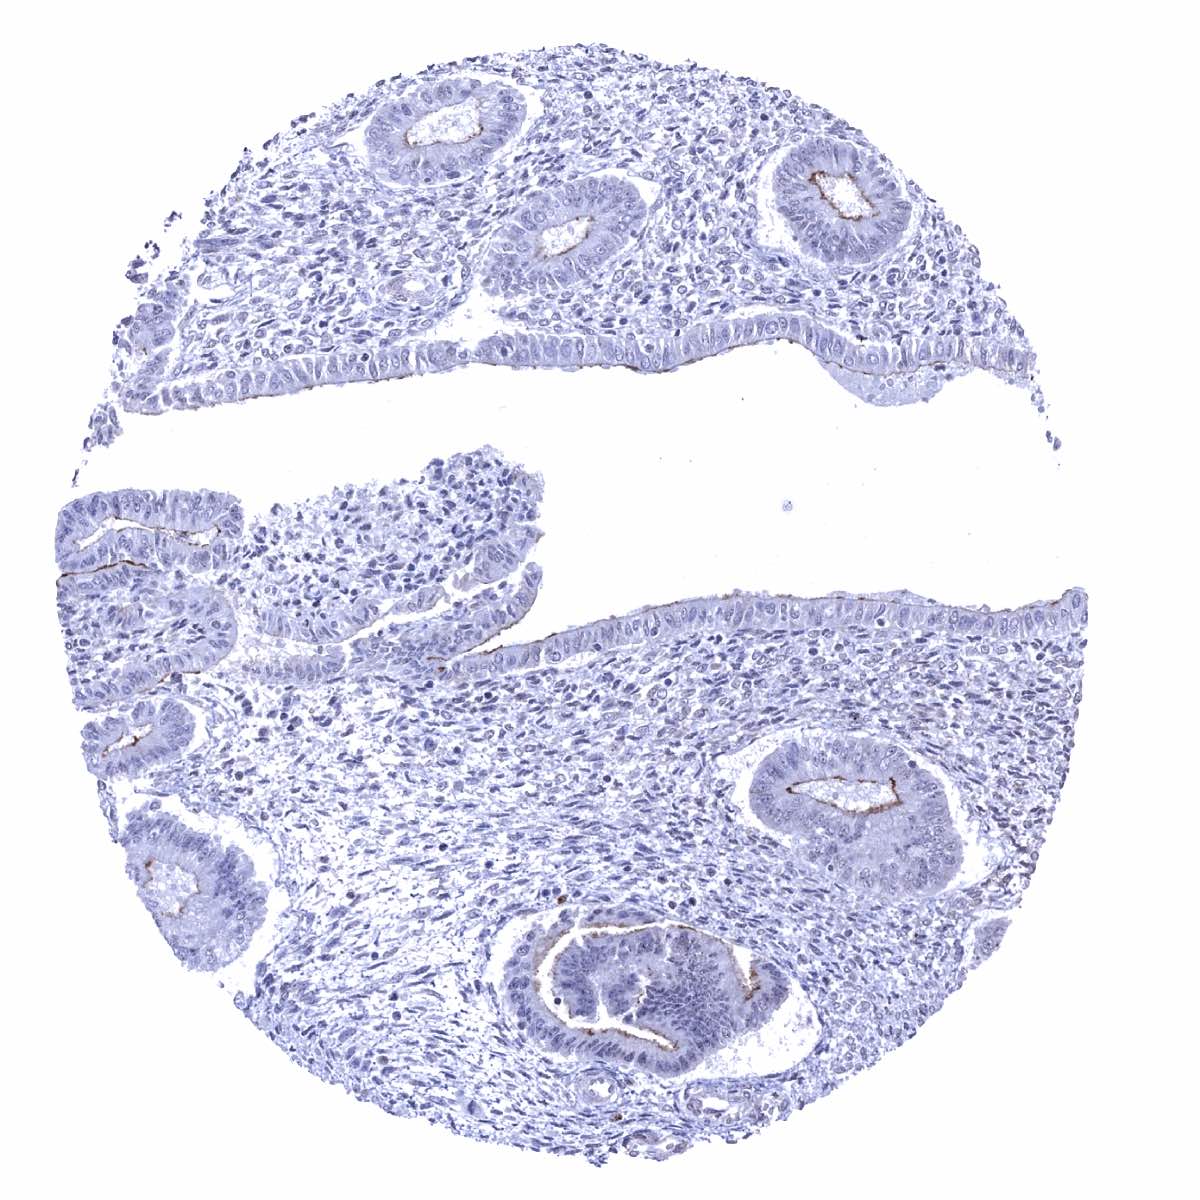
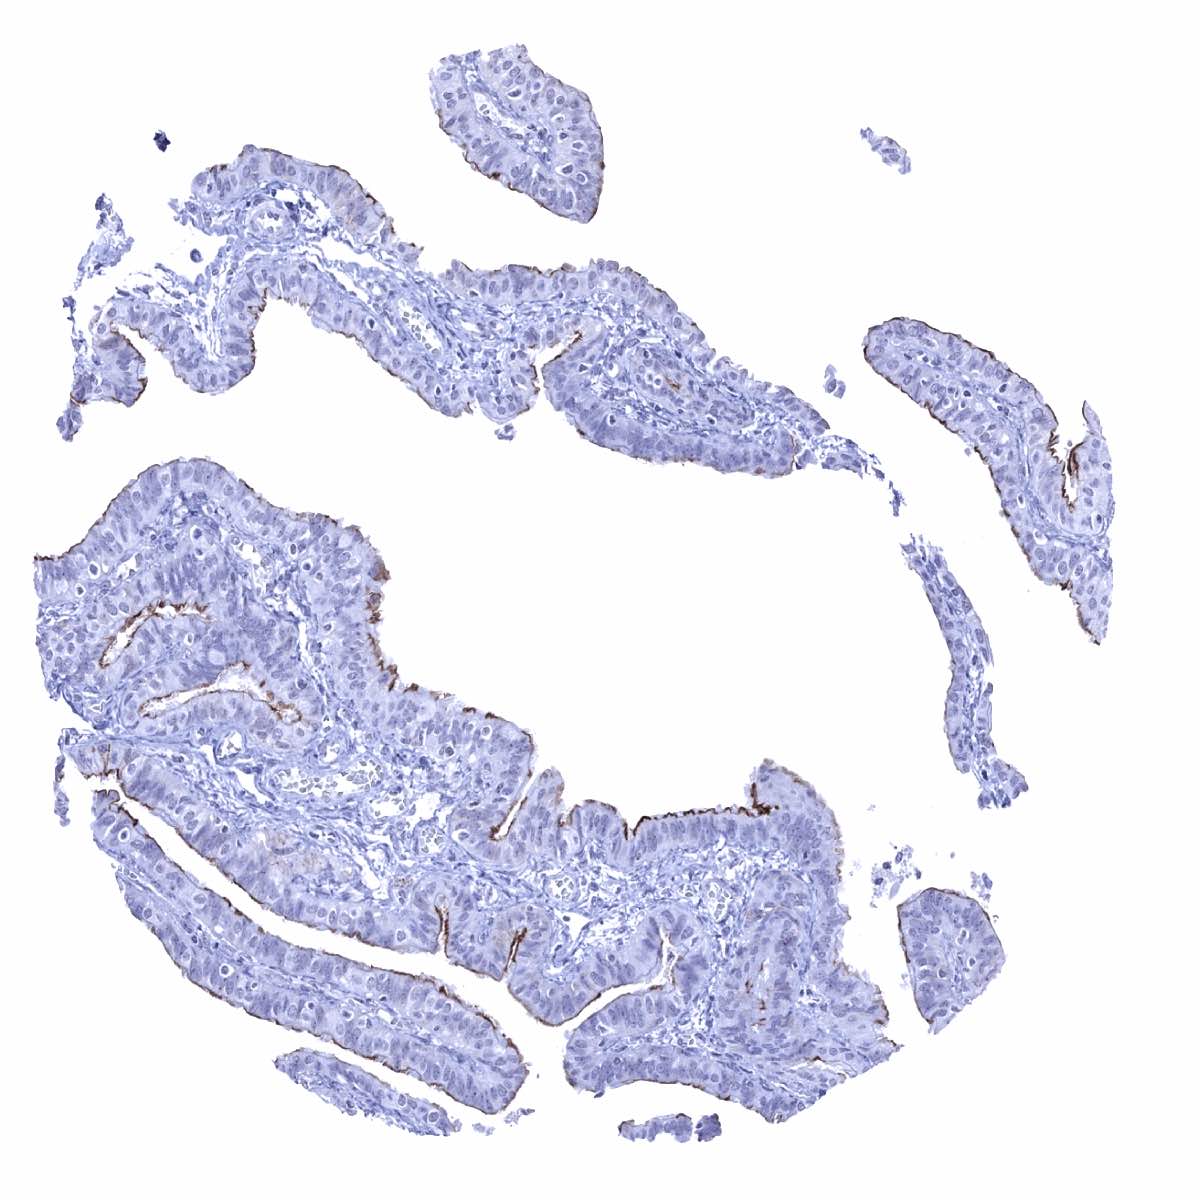
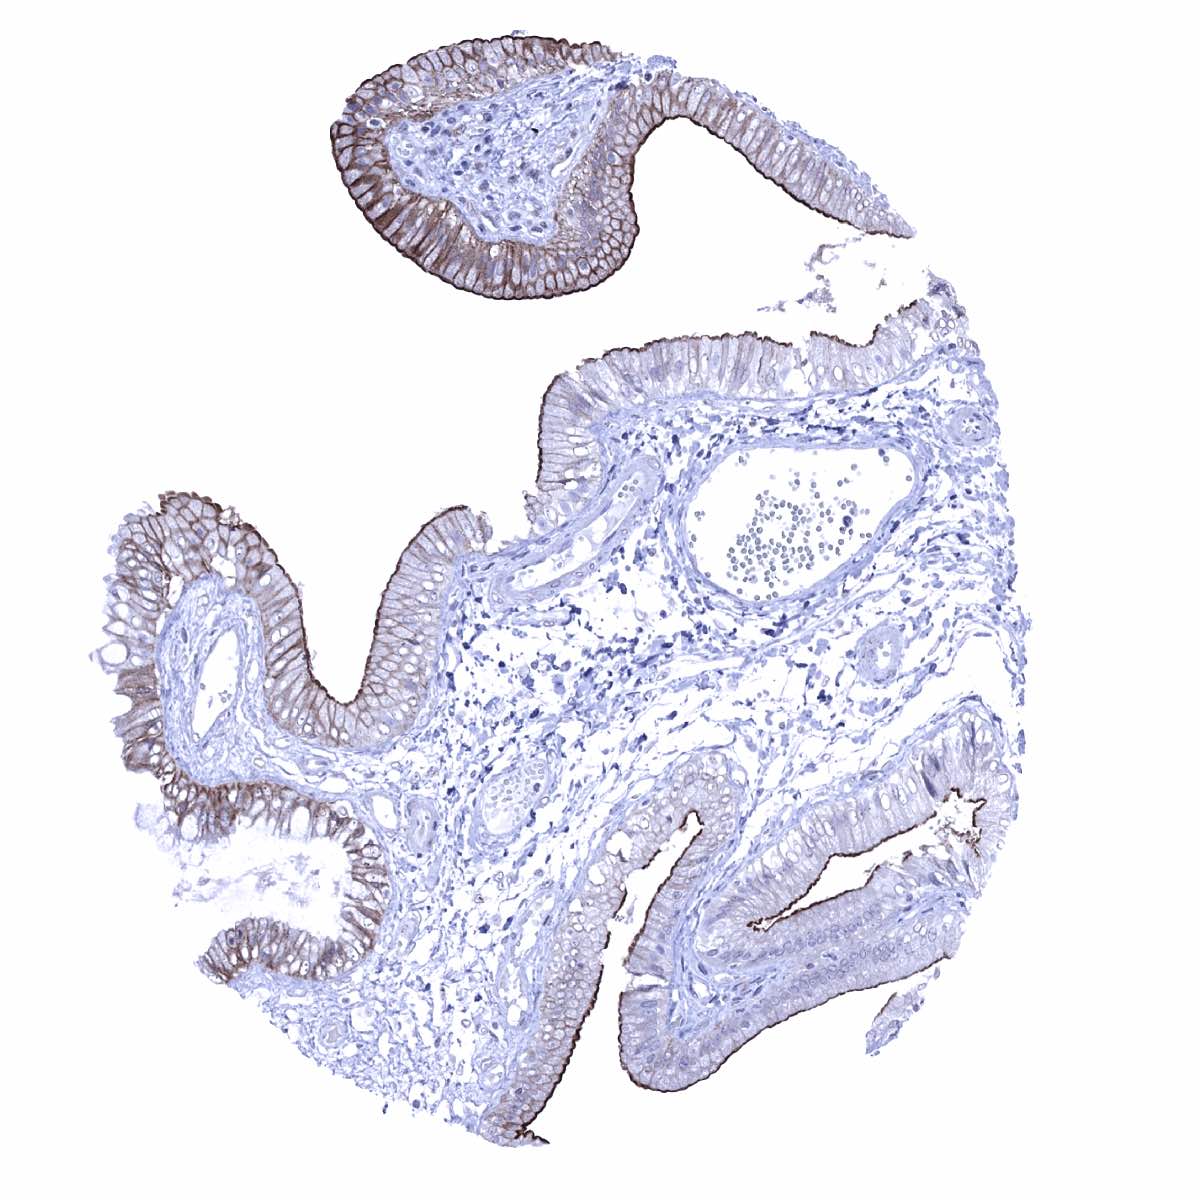
Staining Pattern in Normal Tissues
Dog-1 staining pattern in Normal Tissues with antibody MSVA-201M (images are shown in our “Normal Tissue Gallery”)
| Brain | Cerebrum | Negative. |
| Cerebellum | Negative. | |
| Endocrine Tissues | Thyroid | Weak to moderate staining of some follicular epithelial cells. |
| Parathyroid | Negative. | |
| Adrenal gland | Negative. | |
| Pituitary gland | Negative. | |
| Respiratory system | Respiratory epithelium | Negative. |
| Lung | Negative. | |
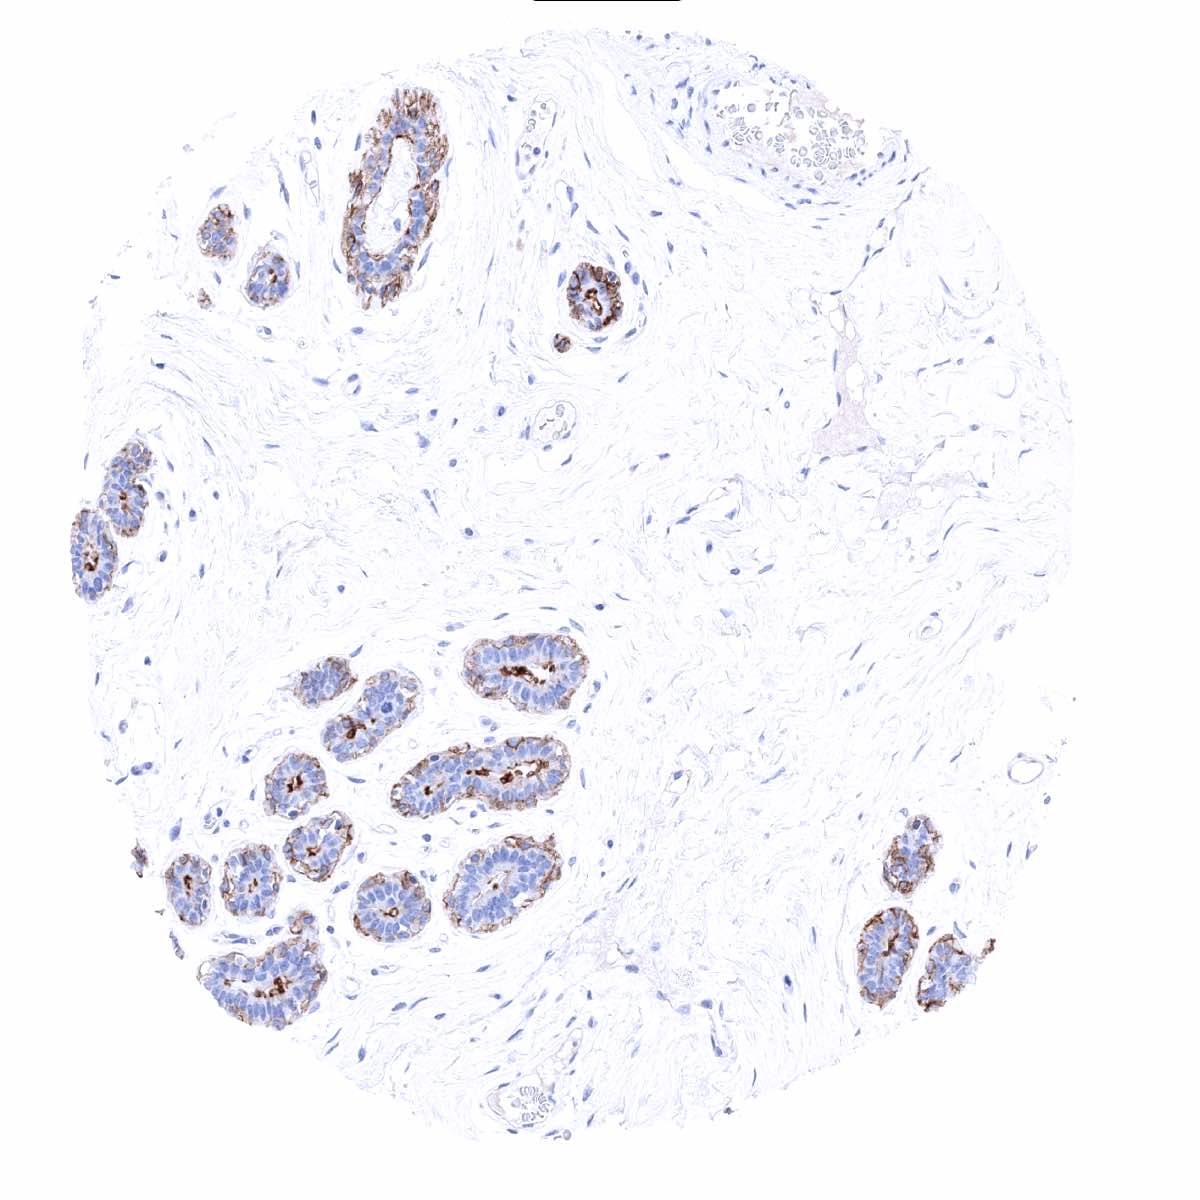
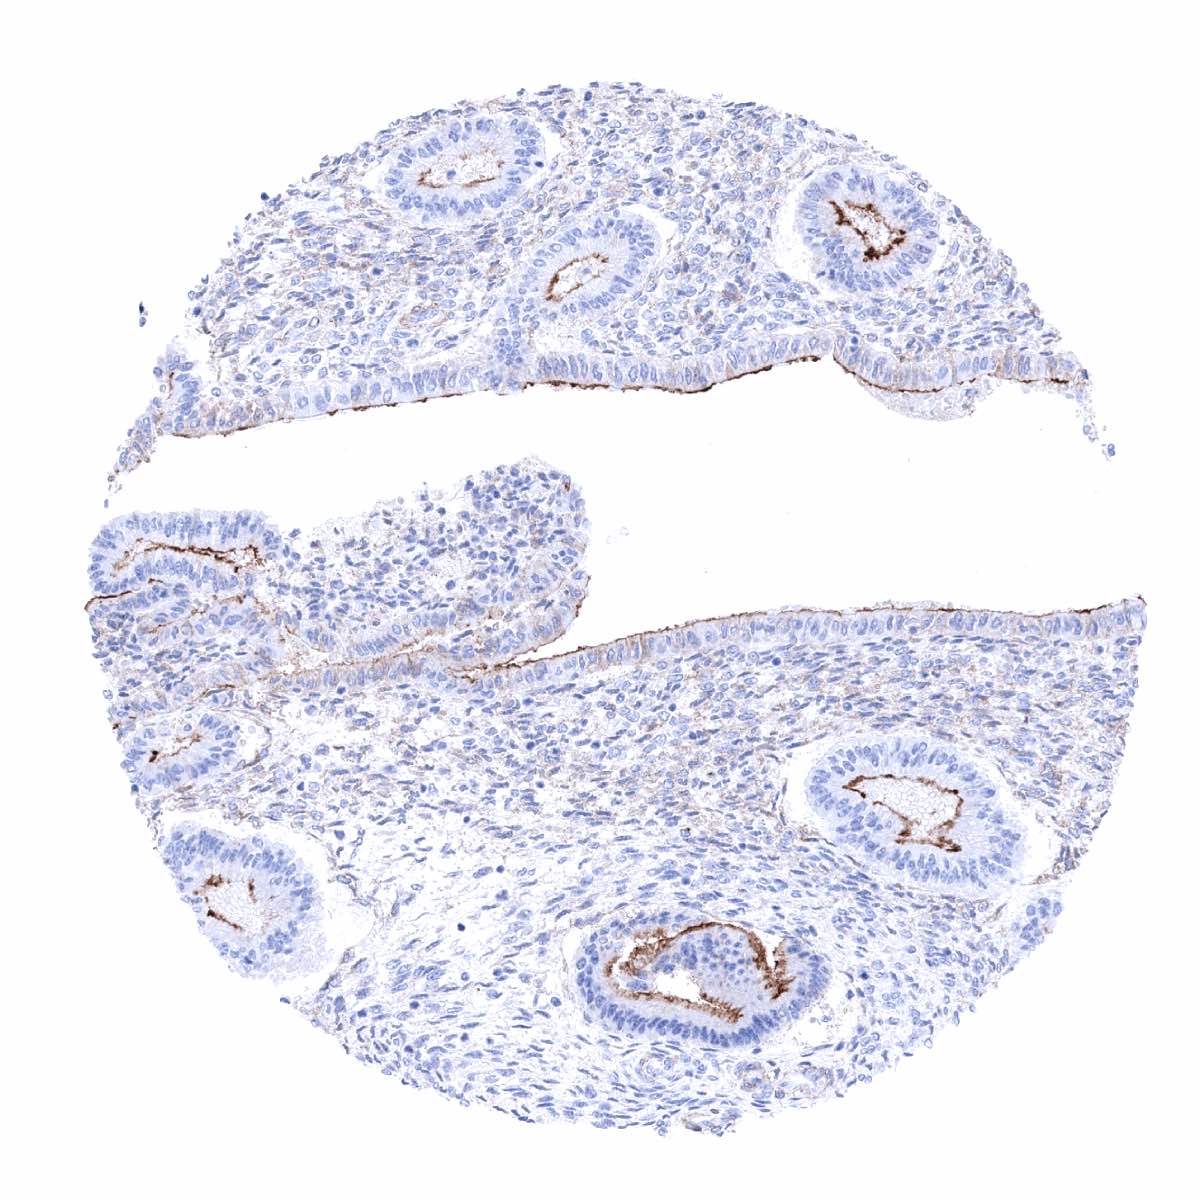
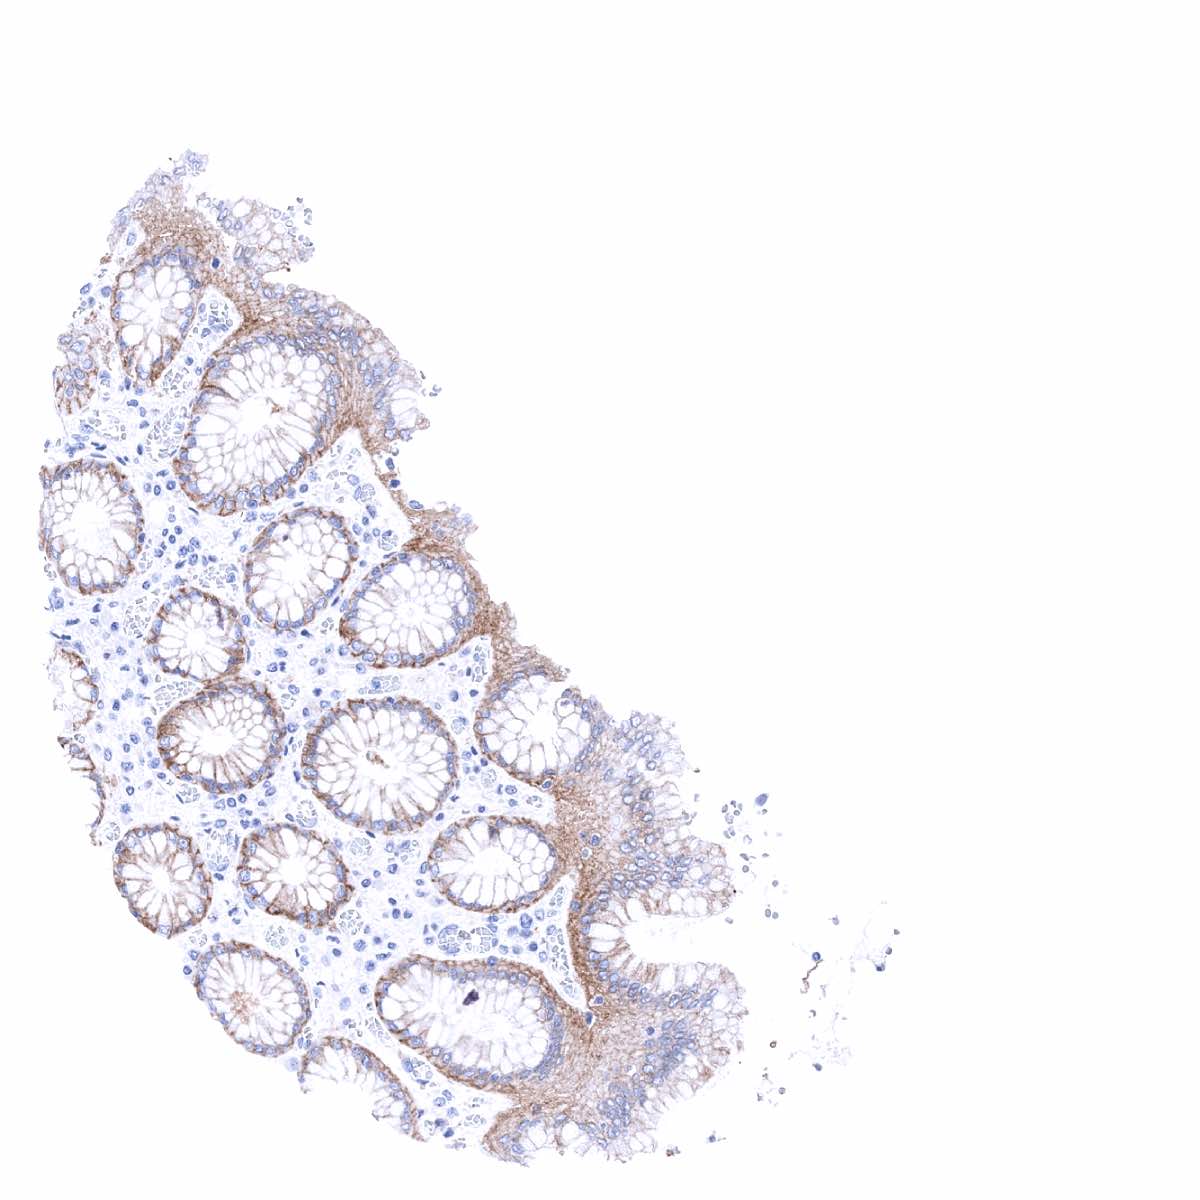
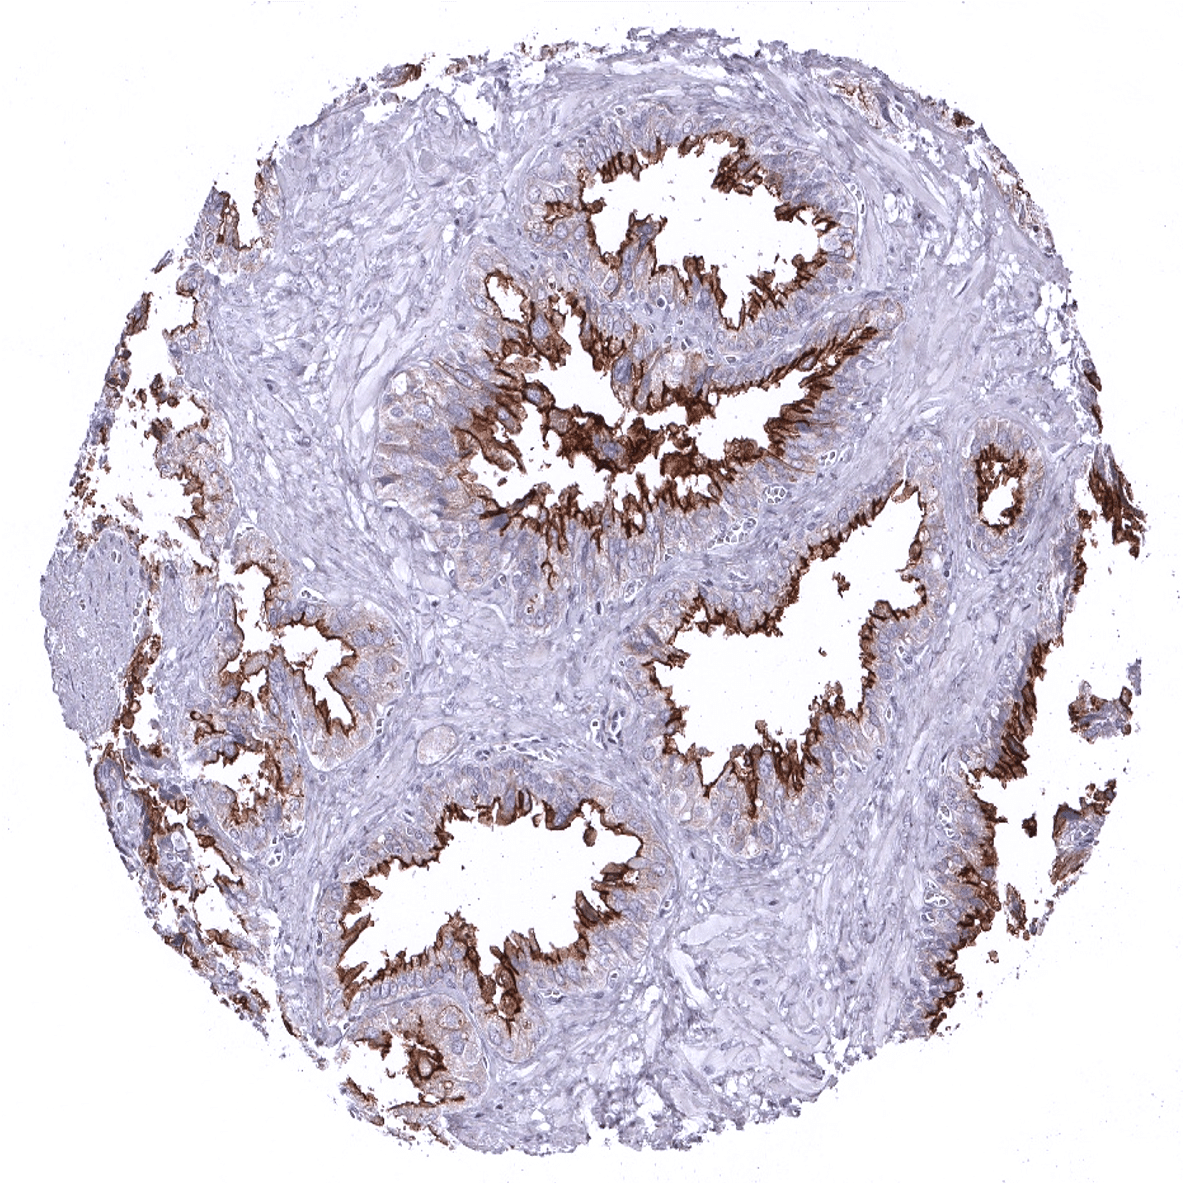
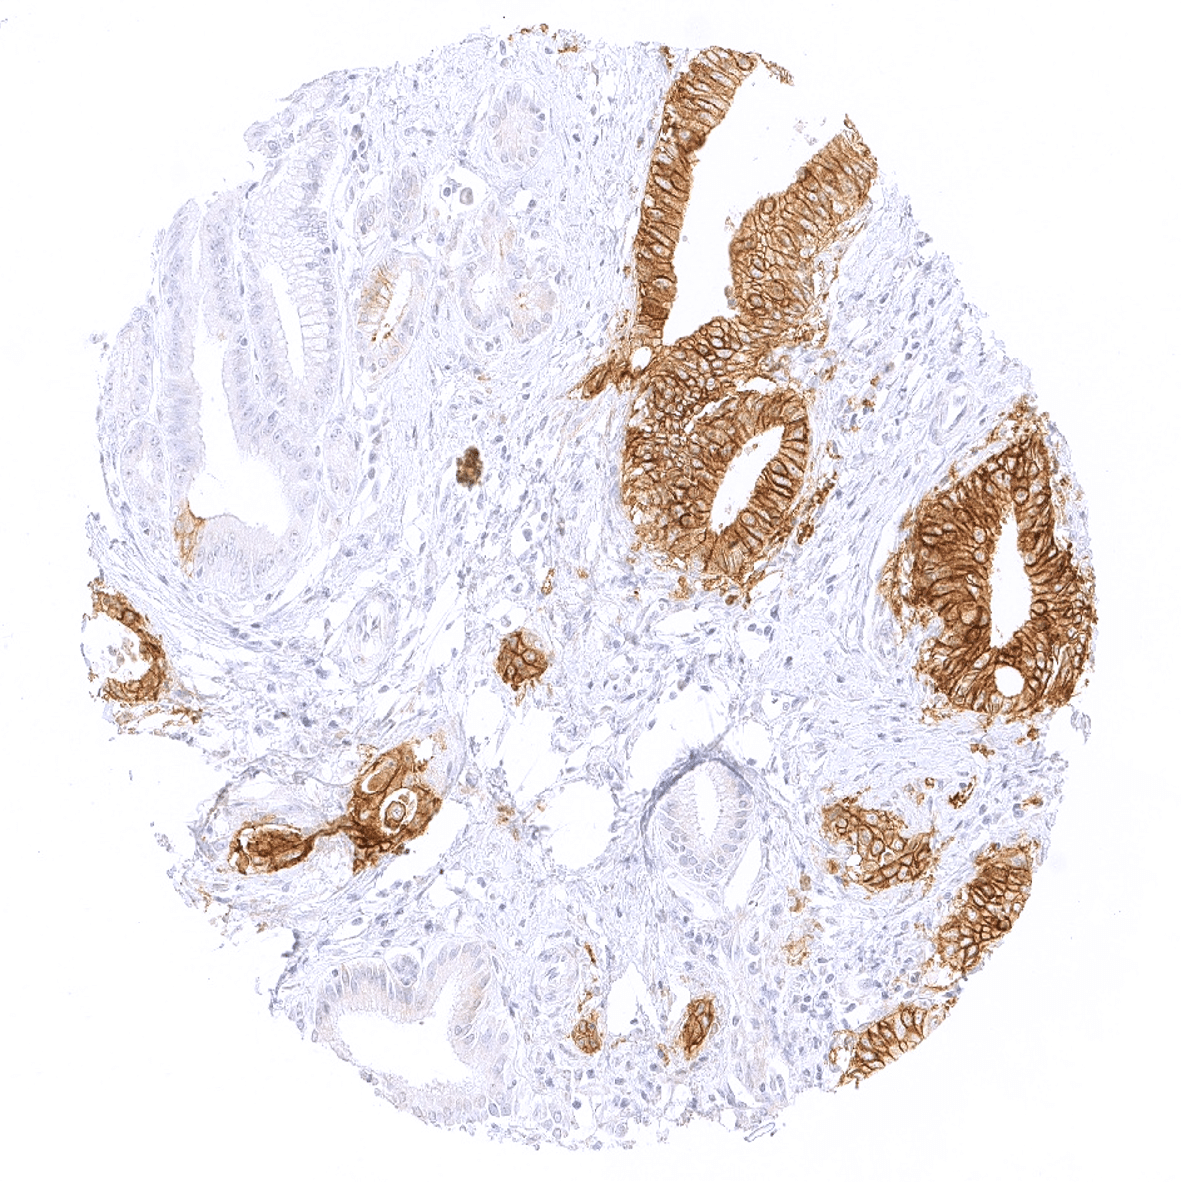
| Gastrointestinal Tract | Salivary glands | Strong apical membranous staining of secreting cells. |
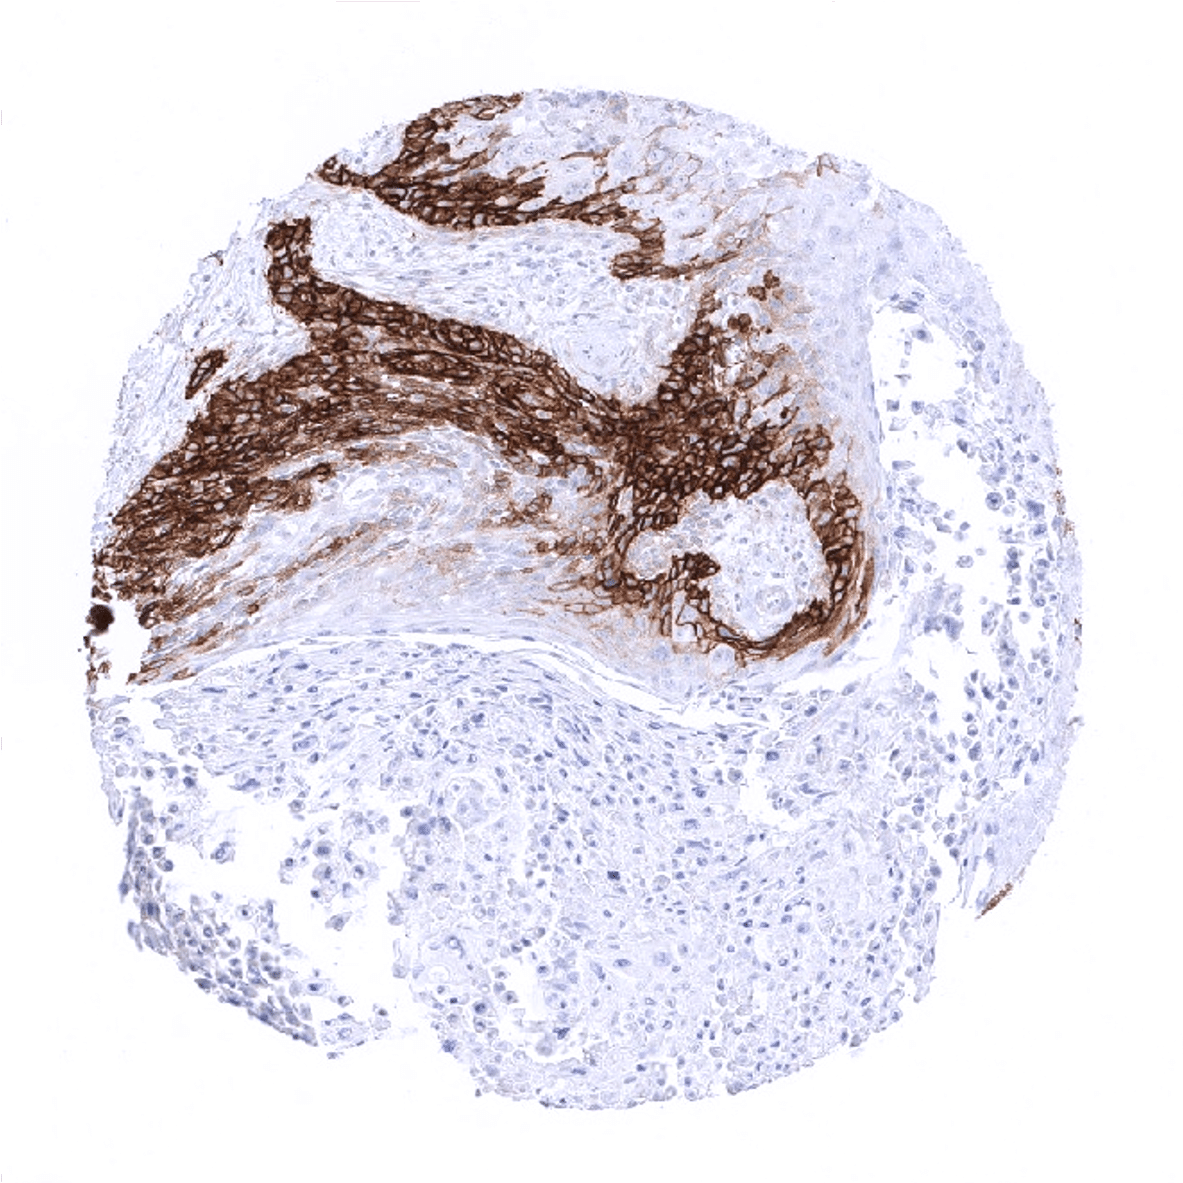
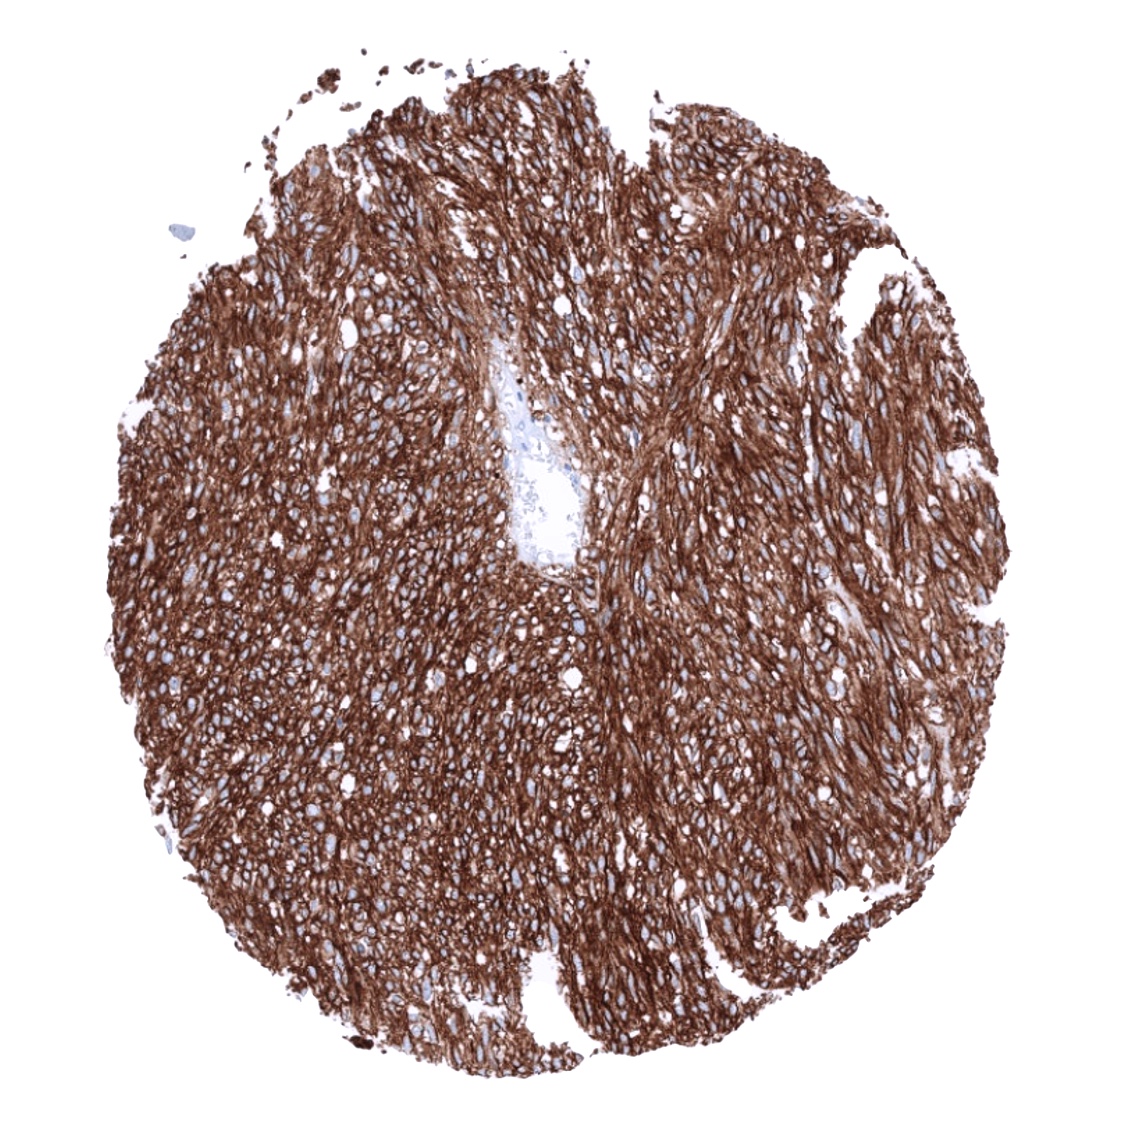
| Esophagus | Strong staining in interstitial cells of Cajal. | |
| Stomach | Strong staining in interstitial cells of Cajal. Weak to moderate staining of stomach epithelial cells, especially of cells in the isthmus/neck region and also of surface epithelium. | |
| Colon | Strong staining in interstitial cells of Cajal. Faint staining of goblet cells in the base of crypts. | |
| Duodenum | Strong staining in interstitial cells of Cajal. | |
| Rectum | Strong staining in interstitial cells of Cajal. | |
| Small intestine | Strong staining in interstitial cells of Cajal. | |
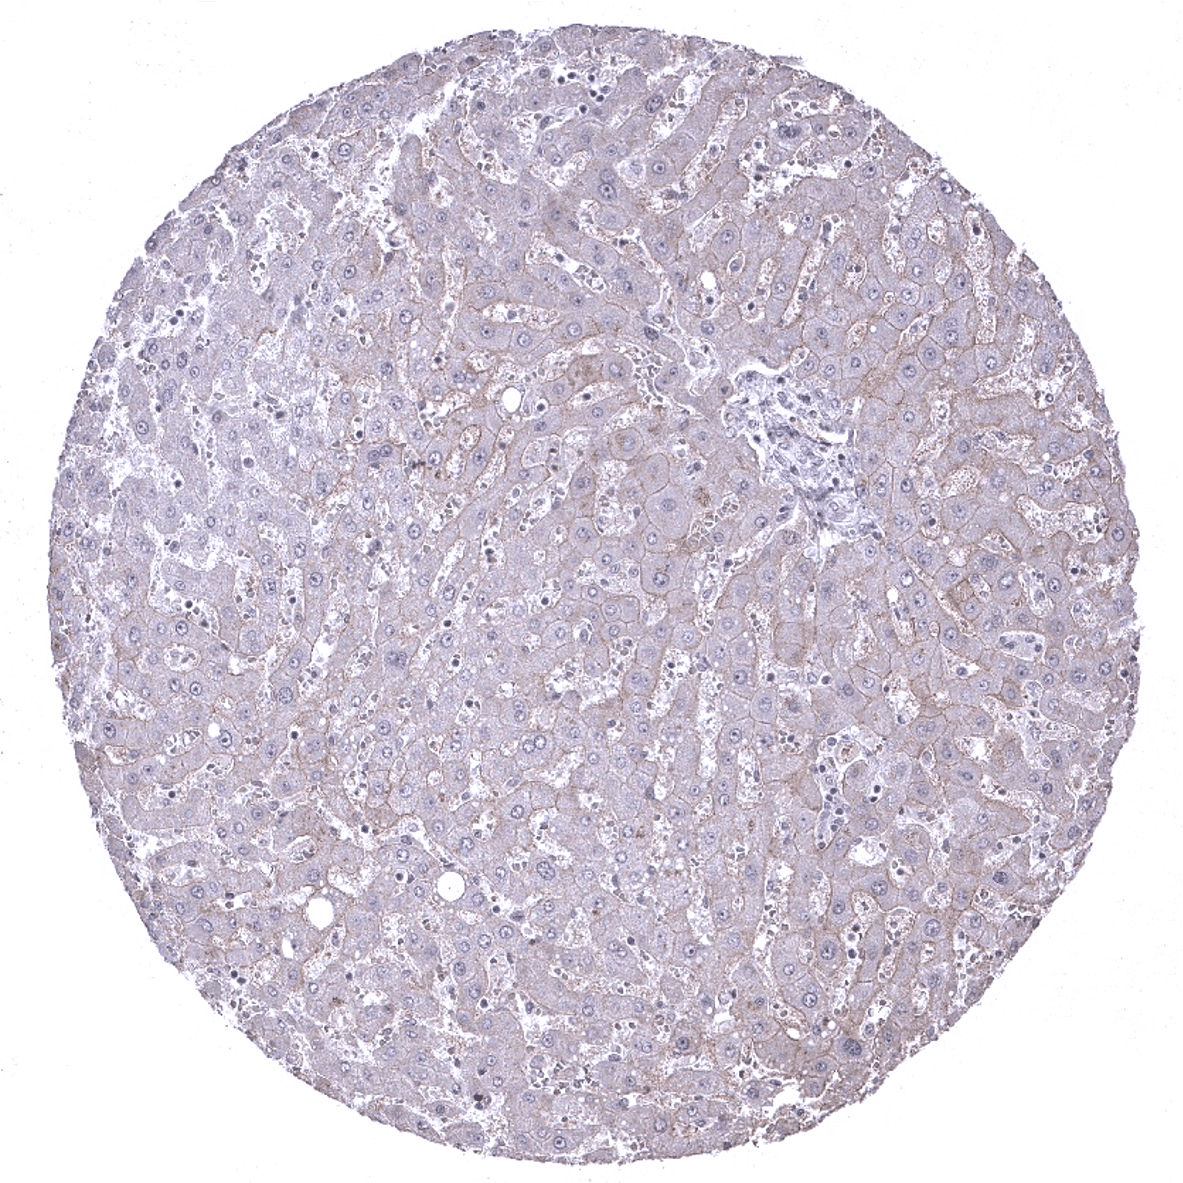
| Liver | Weak membranous staining of a fraction of hepatocytes. | |
| Gallbladder | Moderate staining of surface epithelium. | |
| Pancreas | Negative. | |
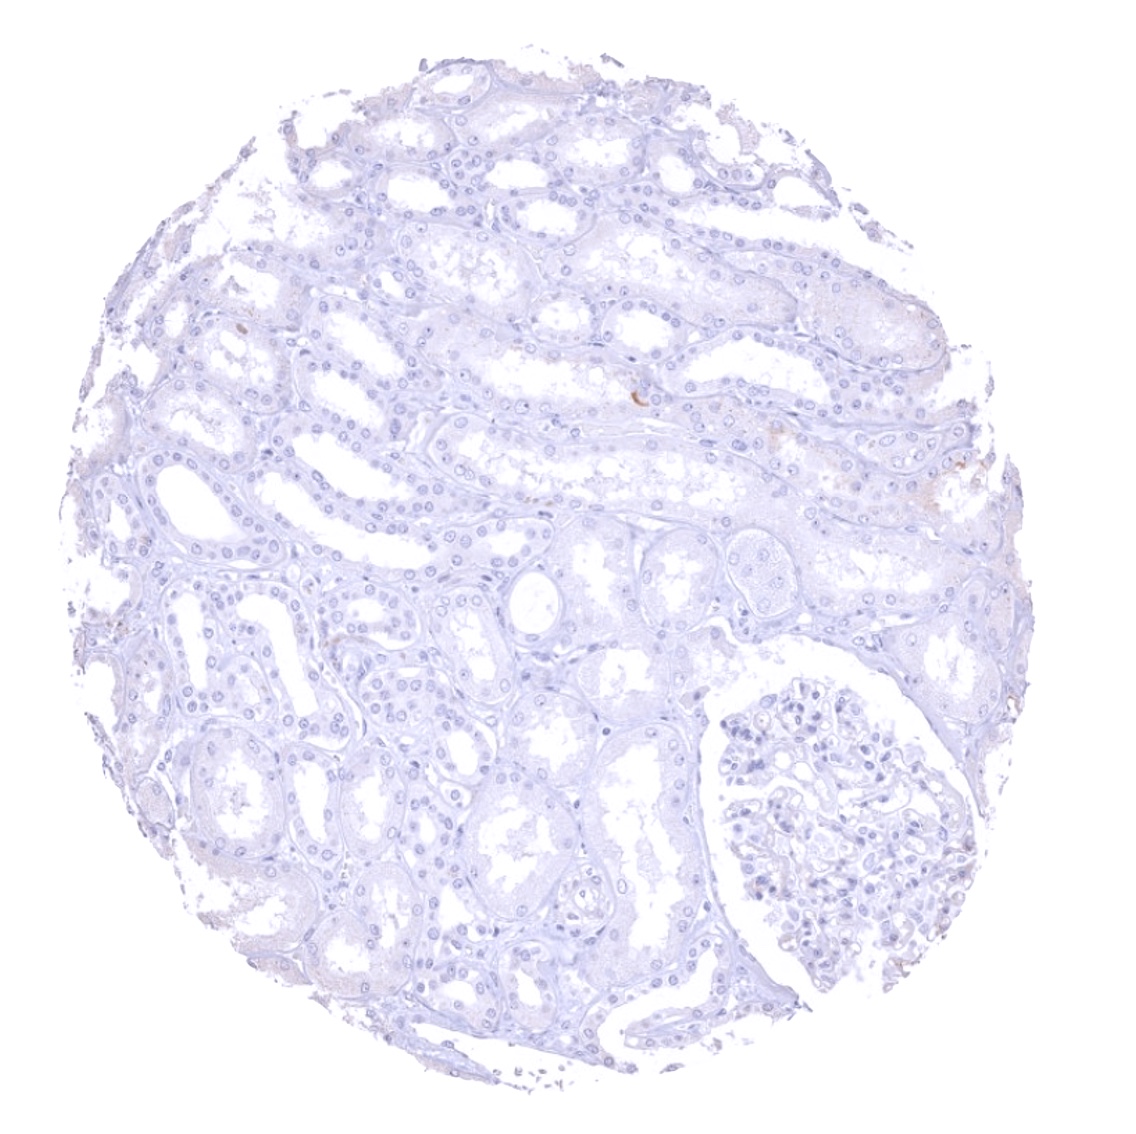
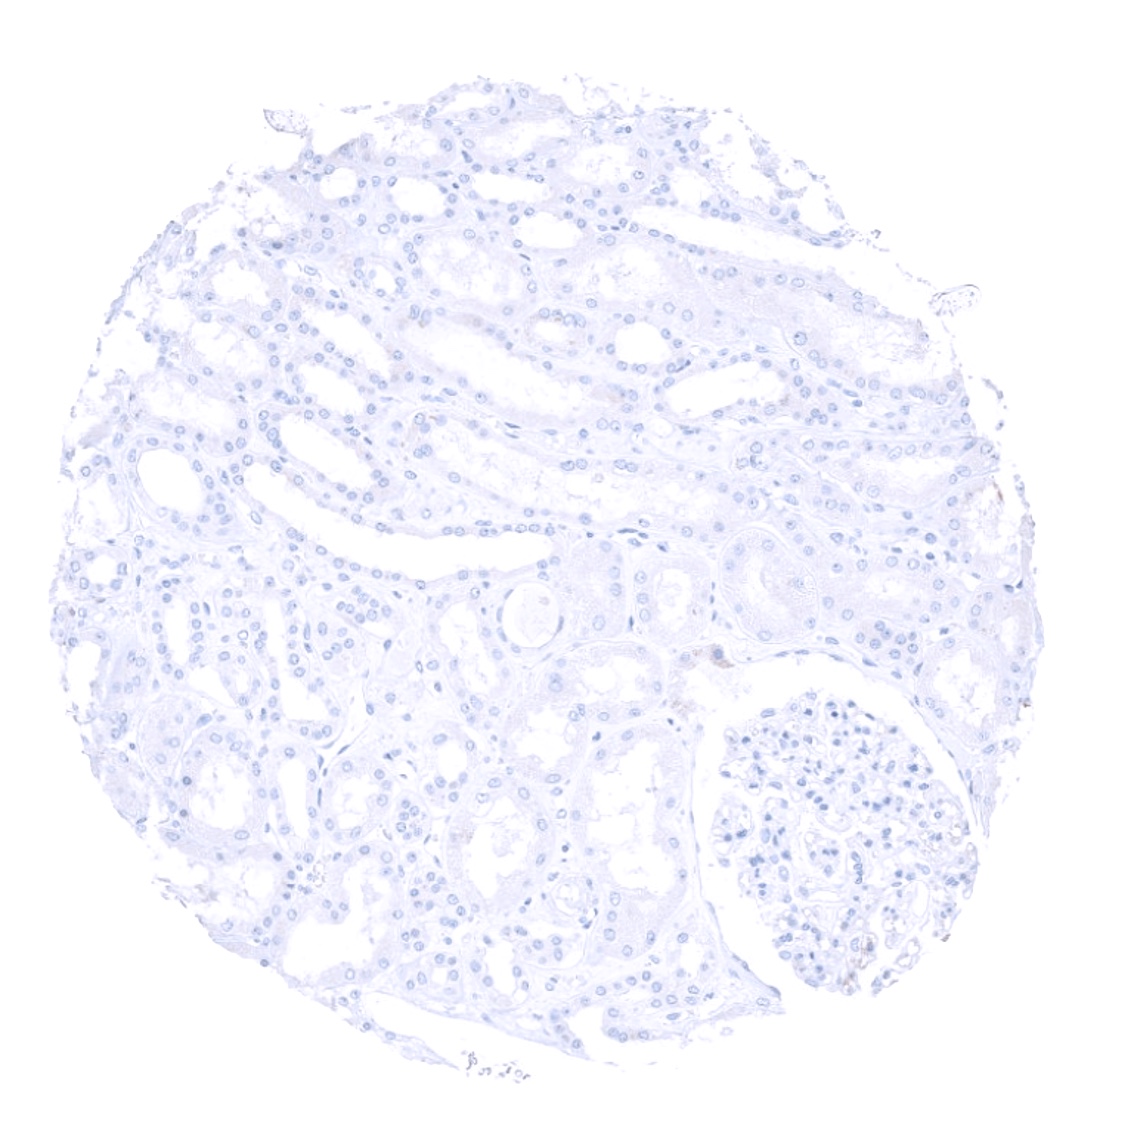
| Genitourinary | Kidney | Negative. |
| Urothelium | Negative. | |
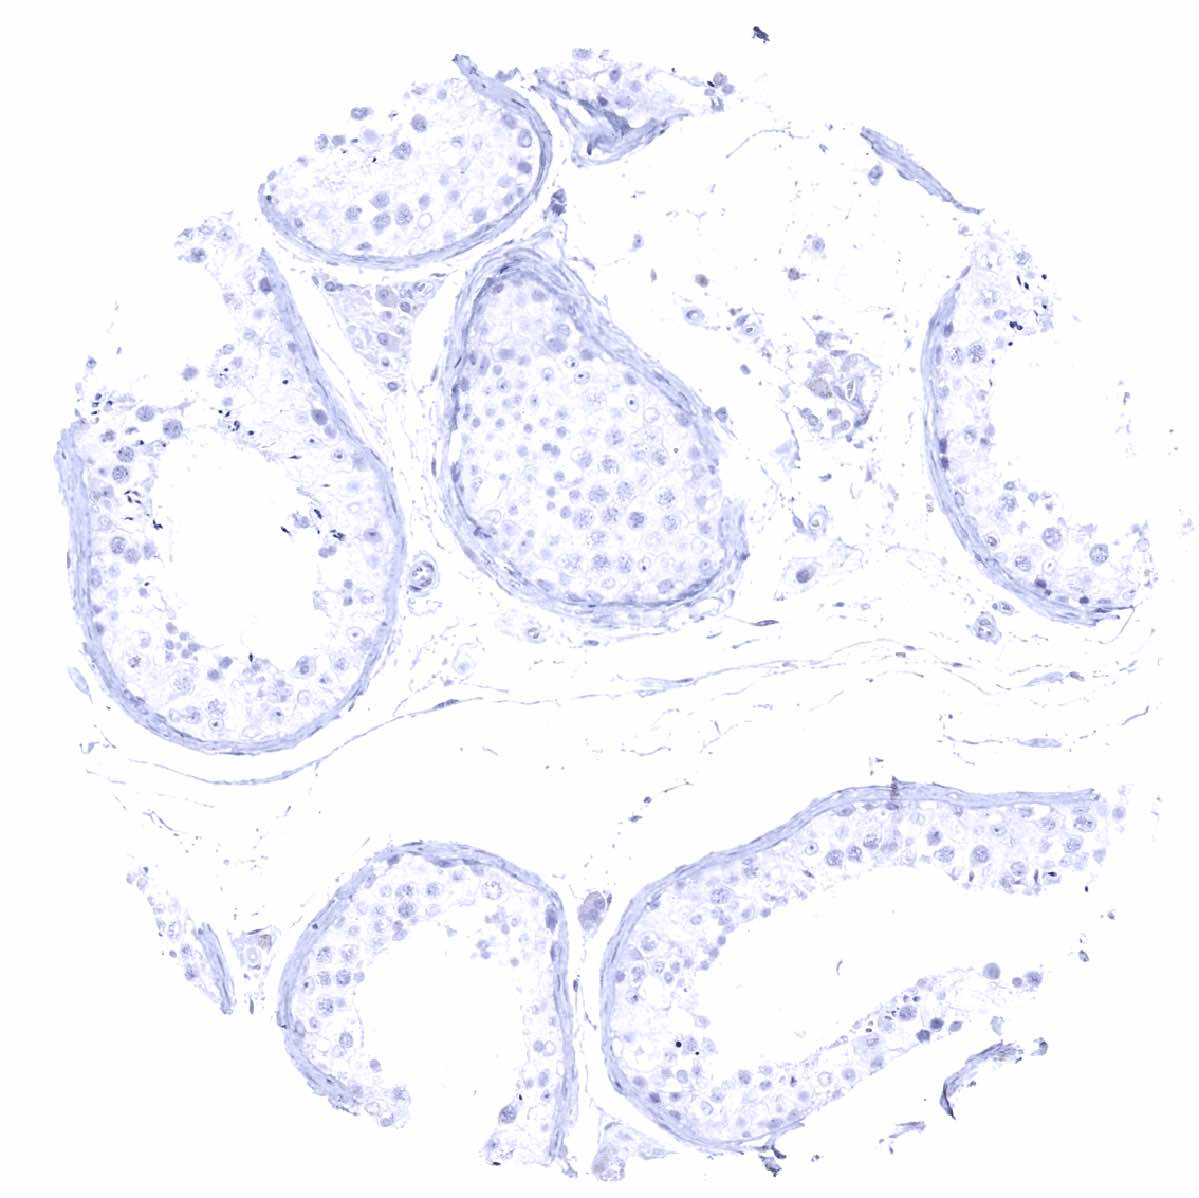
| Male genital | Prostate | Negative. |
| Seminal vesicles | Strong staining of apical membranes of epithelial cells. | |
| Testis | Negative. | |
| Epididymis | Epithelial cell staining is strong in the cauda and less intense in the caput. | |
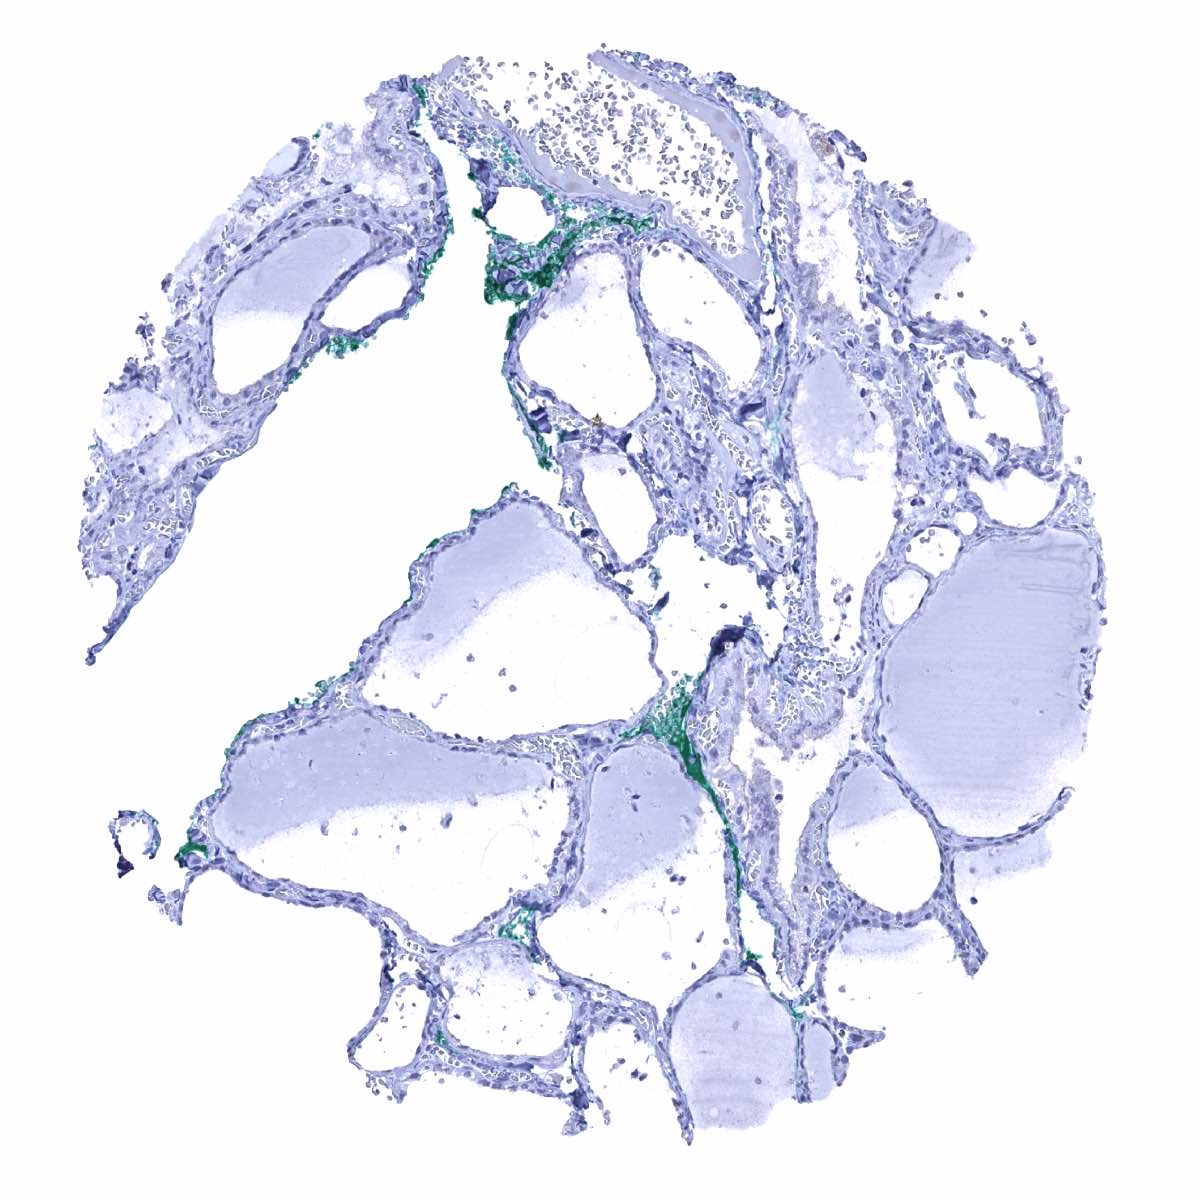
| Female genital | Breast | Moderate staining of myoepithelial cells. |
| Uterus, myometrium | Negative. | |
| Uterus, ectocervix | Negative. | |
| Uterus endocervix | Focal weak to moderate apical-membranous staining of some glands in some samples. | |
| Uterus, endometrium | Focal weak to moderate apical-membranous staining of some glands in some samples. In some samples, stroma may also stain. | |
| Fallopian Tube | Strong staining of apical membranes of epithelial cells. | |
| Ovary | Negative. | |
| Placenta early | Negative. | |
| Placenta mature | Negative. | |
| Amnion | Weak positivity. | |
| Chorion | Negative. | |
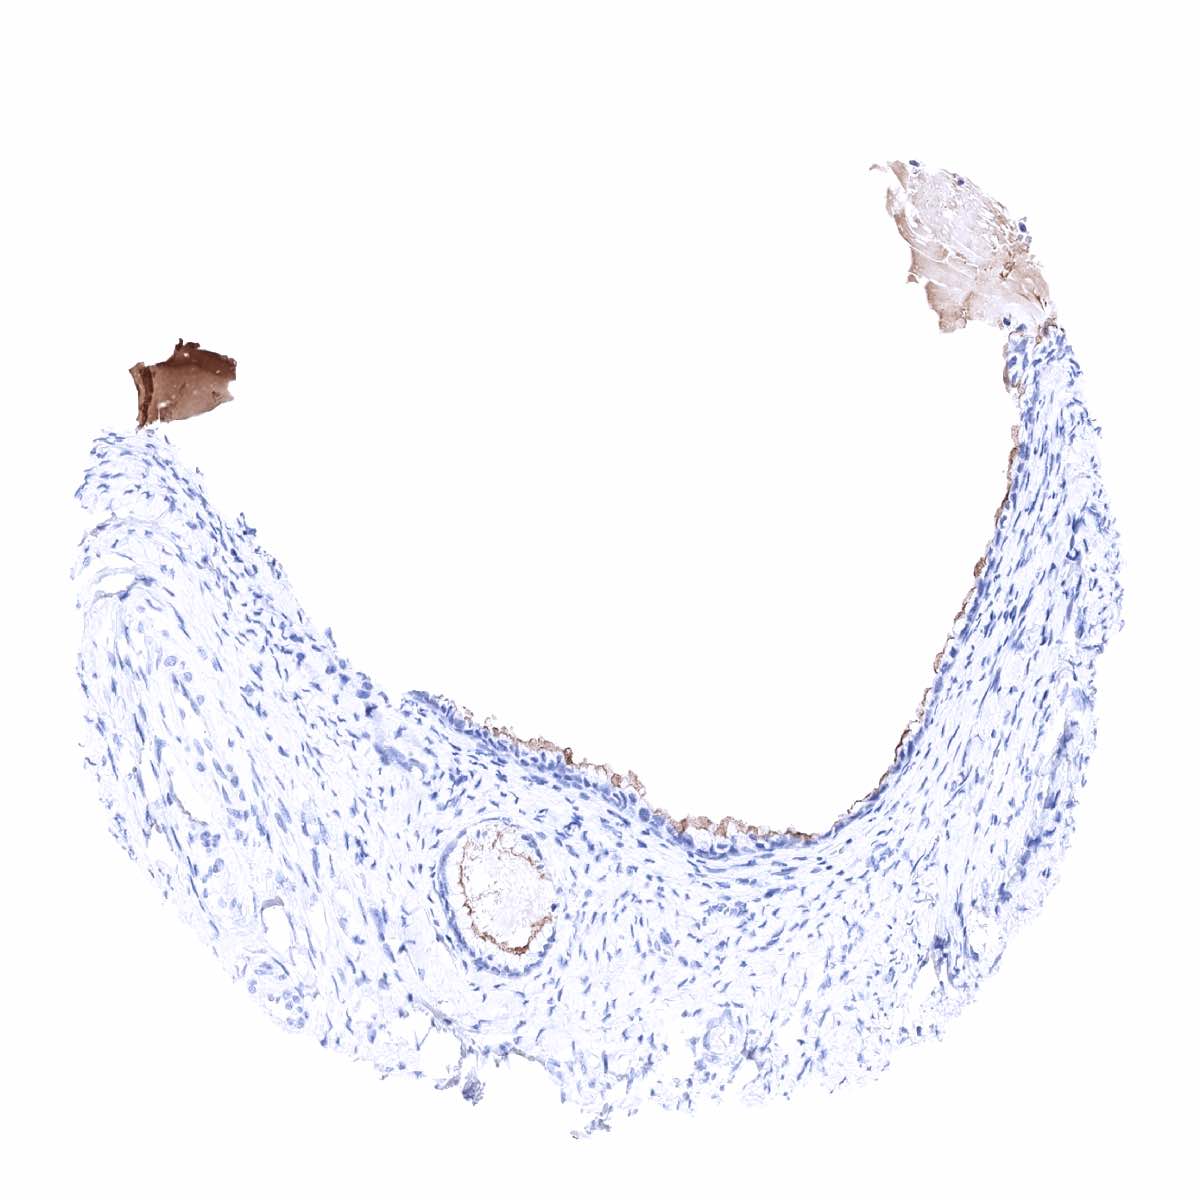
| Skin | Epidermis | Negative. |
| Sebaceous glands | Negative. | |
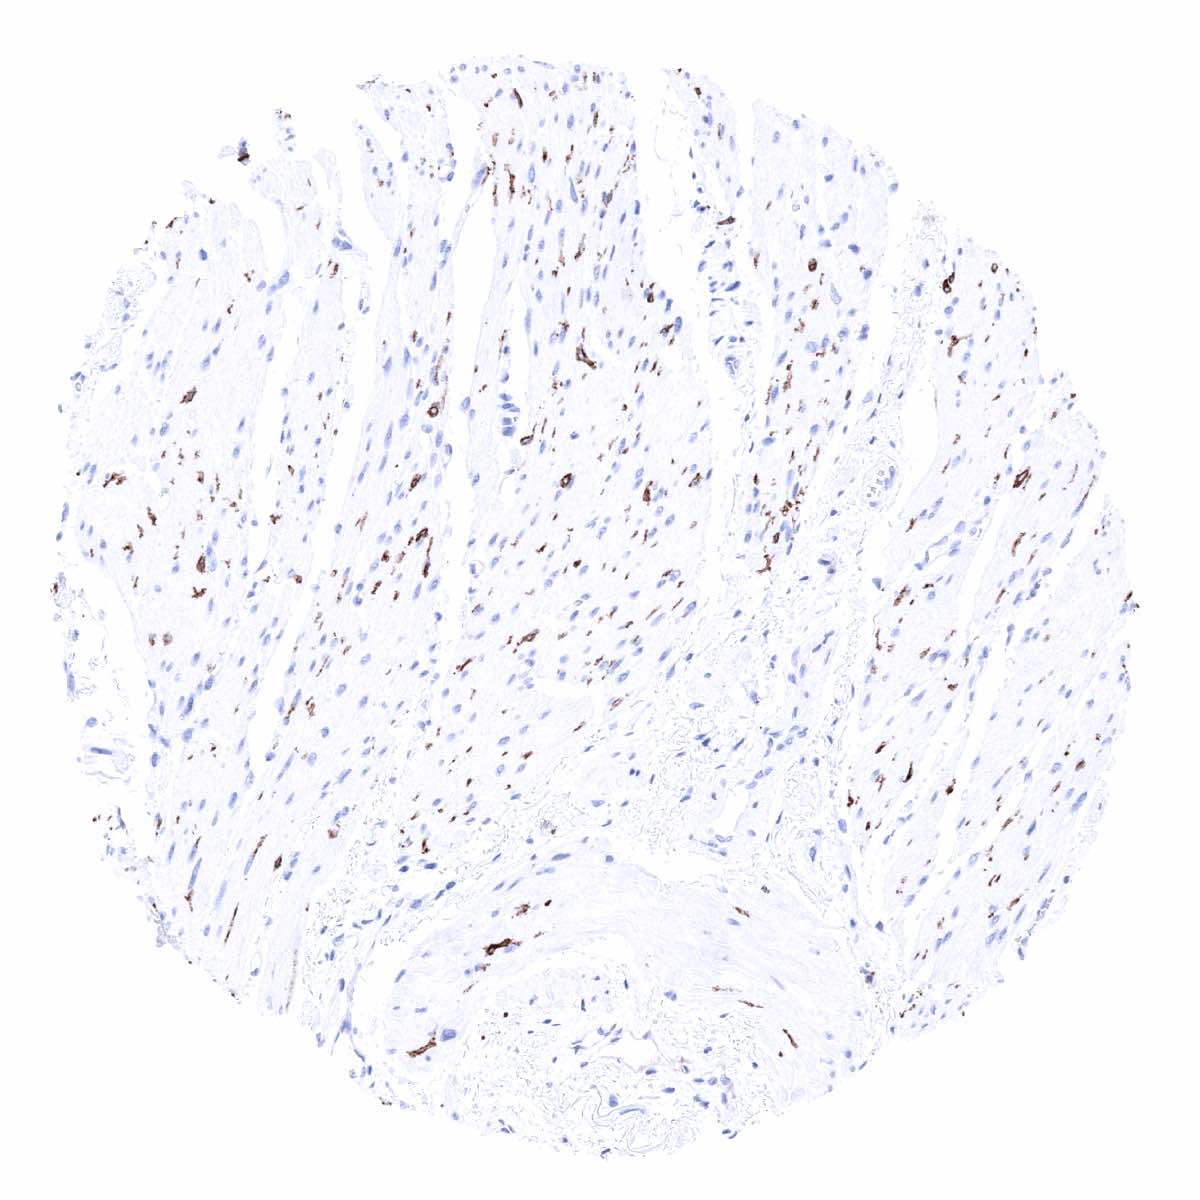
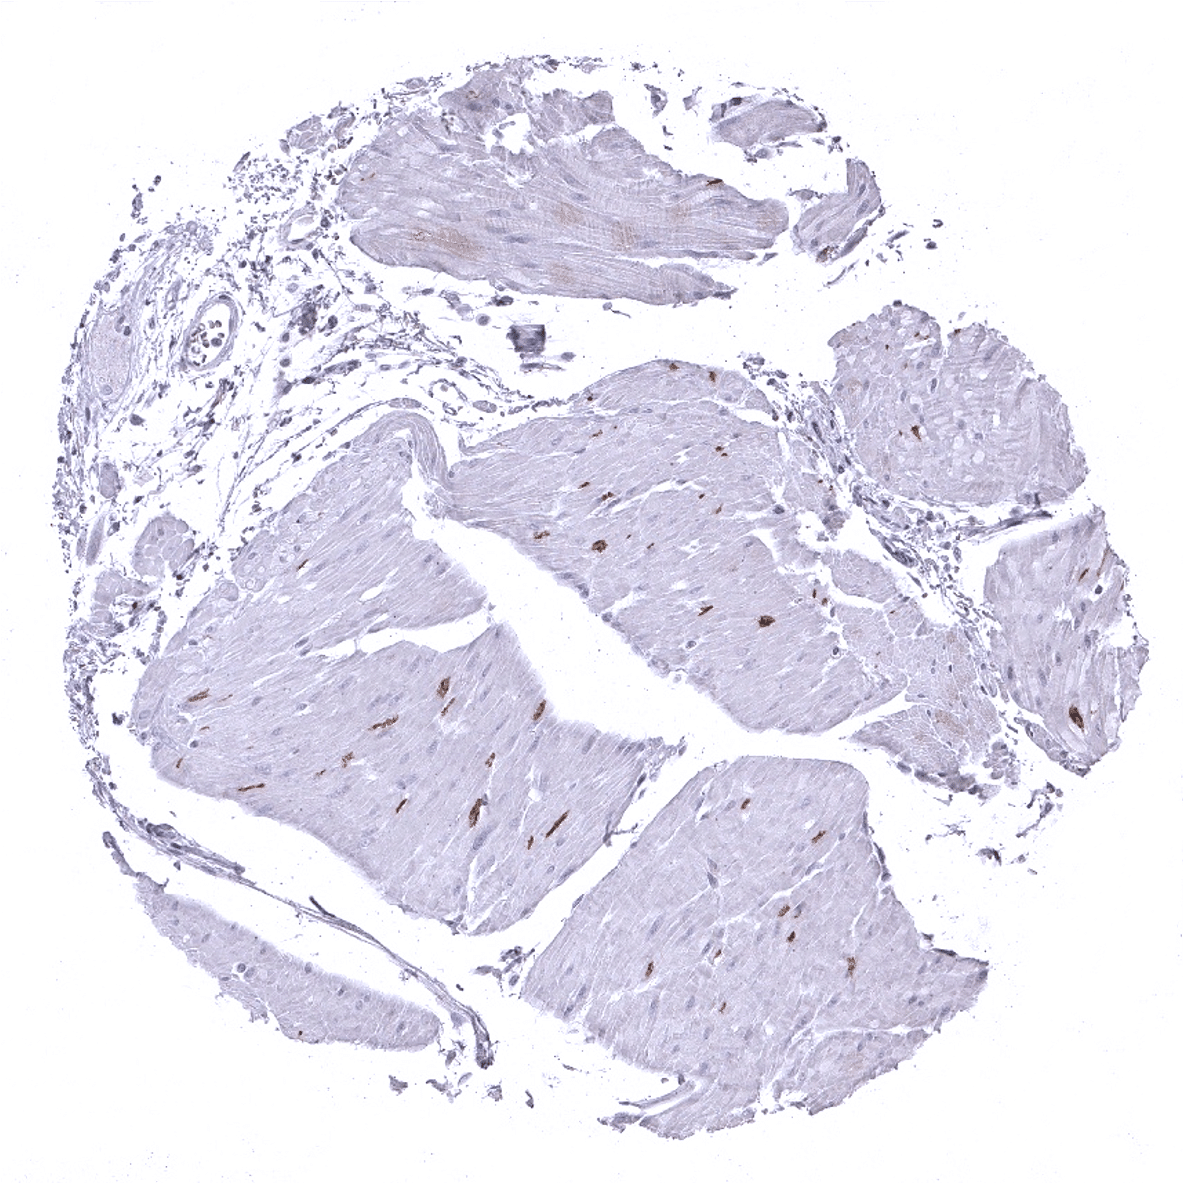
| Muscle/connective tissue | Heart muscle | Negative. |
| Skeletal muscle | Negative. | |
| Smooth muscle | Strong staining in interstitial cells of Cajal. | |
| Vessel walls | Negative. | |
| Fat | Negative. | |
| Stroma | Negative. | |
| Endothelium | Negative. | |
| Bone marrow/lymphoid | Bone marrow | Negative. |
| Lymph node | Negative. | |
| Spleen | Negative. | |
| Thymus | Negative. | |
| Tonsil | Negative. | |
| Remarks | DOG1 immunostaining is predominantly membranous and often located at apical “secreting” membranes. |
The normal tissue findings obtained by the antibody MSVA-201M are largely comparable to the RNA data described in the Human Protein Atlas (Tissue expression Dog-1): In addition, the findings provided here clarify several aspects on DOG1 protein expression, such as for example that liver cell expression is membranous and not cytoplasmic as suggested by images in the protein atlas . Protein atlas data suggest a DOG1 protein expression in adrenal gland which is neither supported by existing RNA data nor by MSVA-201 staining data.
Suggested positive tissue control: Appendix: an at least moderate, predominantly membranous staining should be seen in Cajal cells in the muscular wall and a weak membranous staining should be seen in columnar epithelial cells in the basal part of the crypts of the appendix.
Suggested negative tissue control: Appendix: Staining should be absent in the majority of cells in the muscular wall and in epithelial cells located at the surface.

Staining Pattern in Relevant Tumor Types
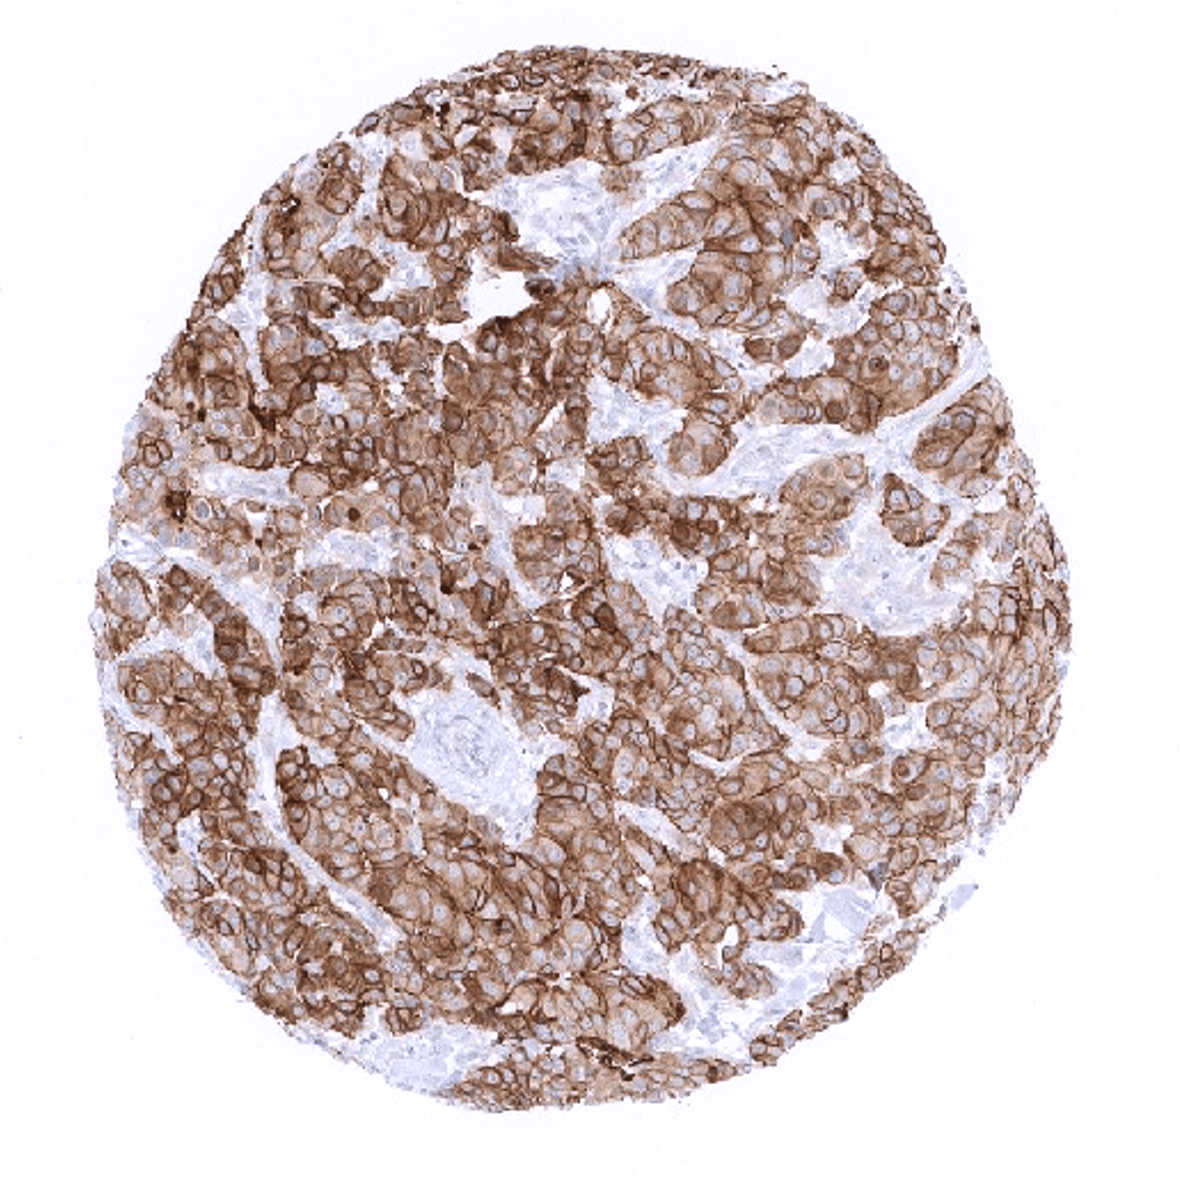
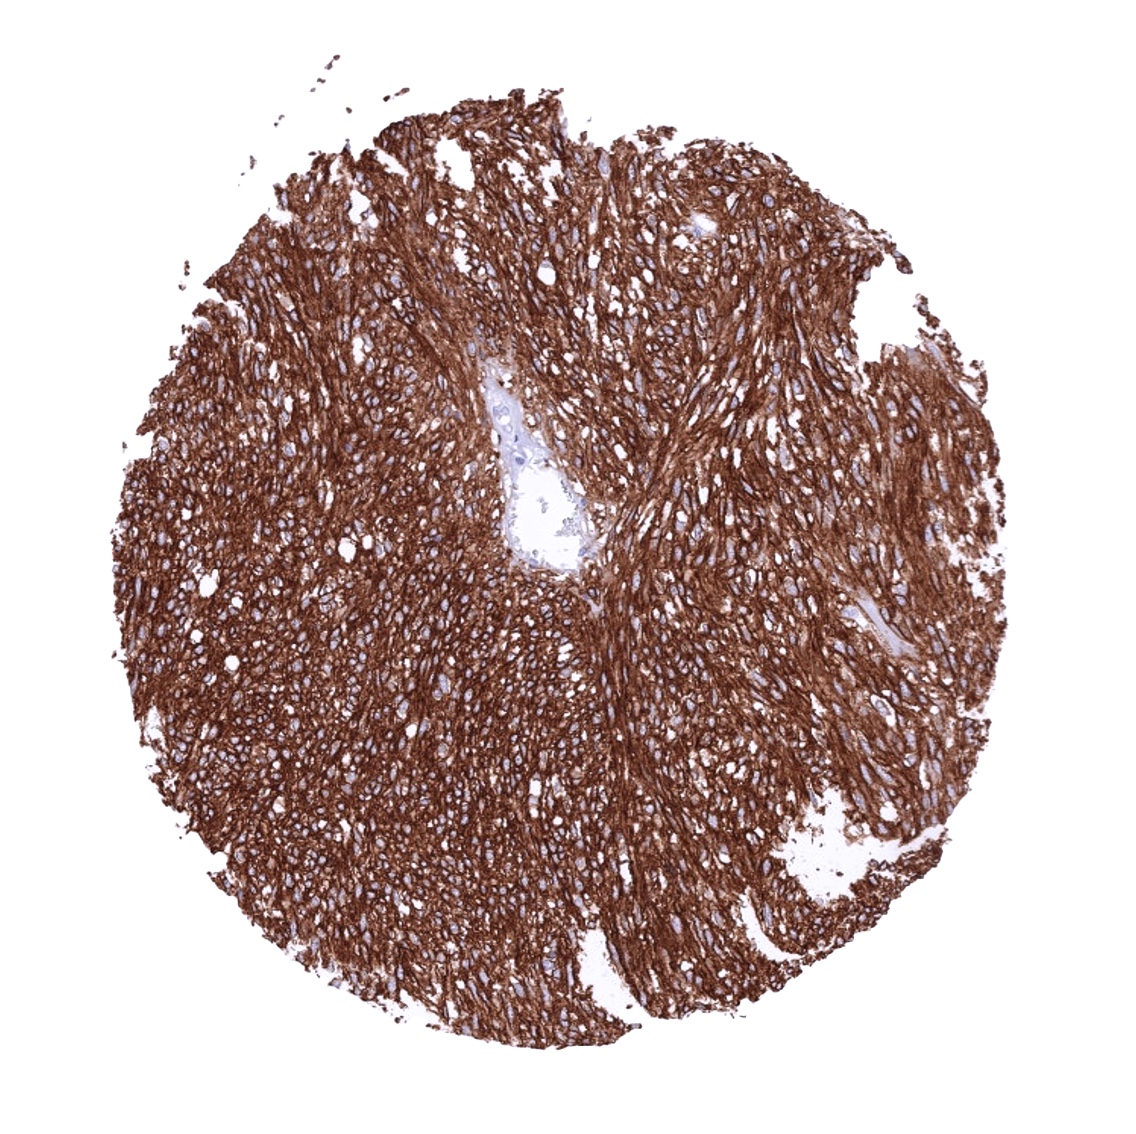
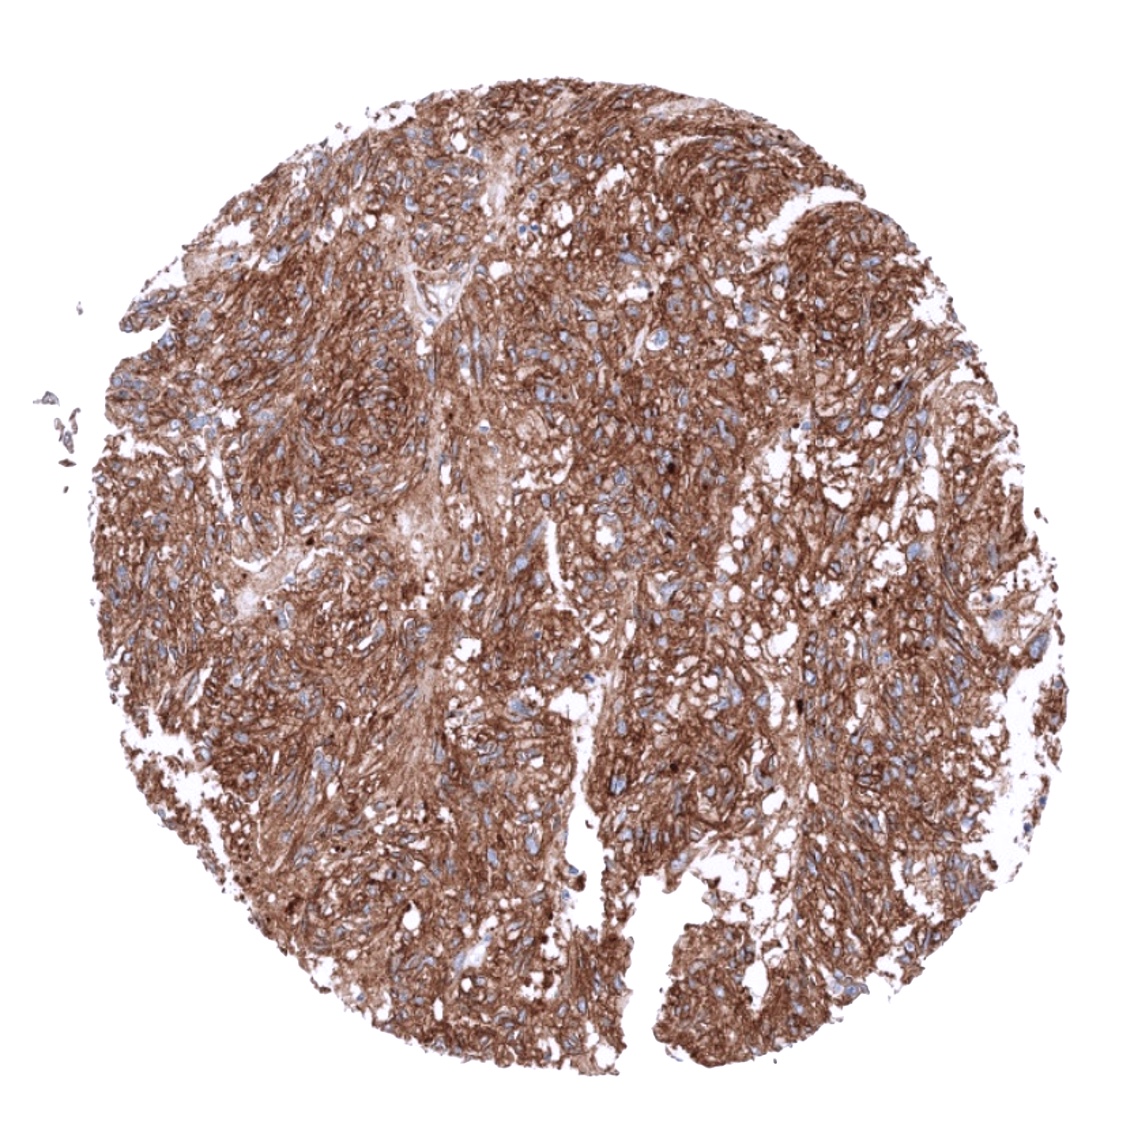
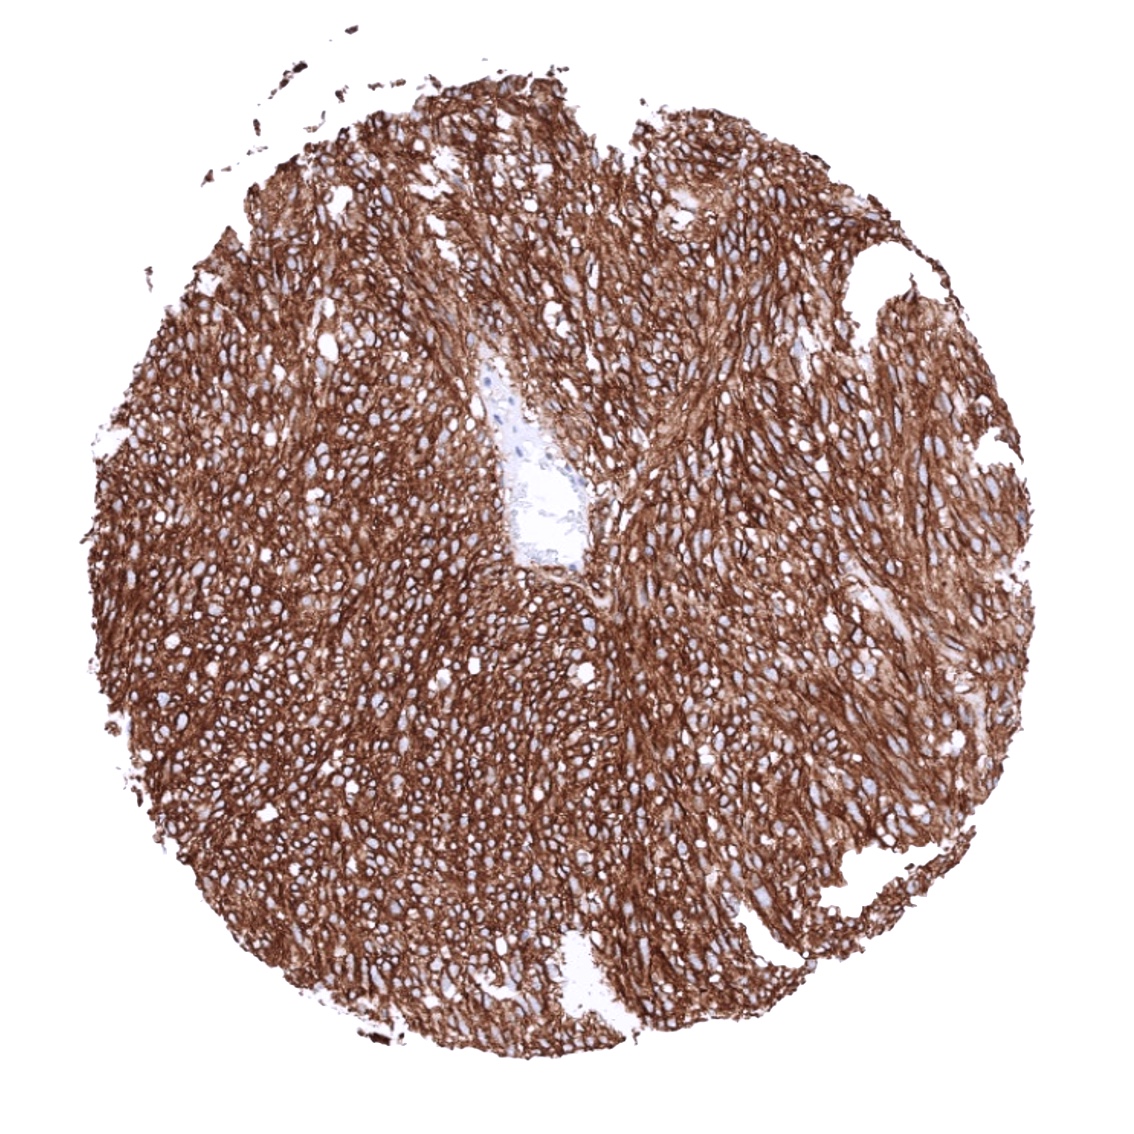
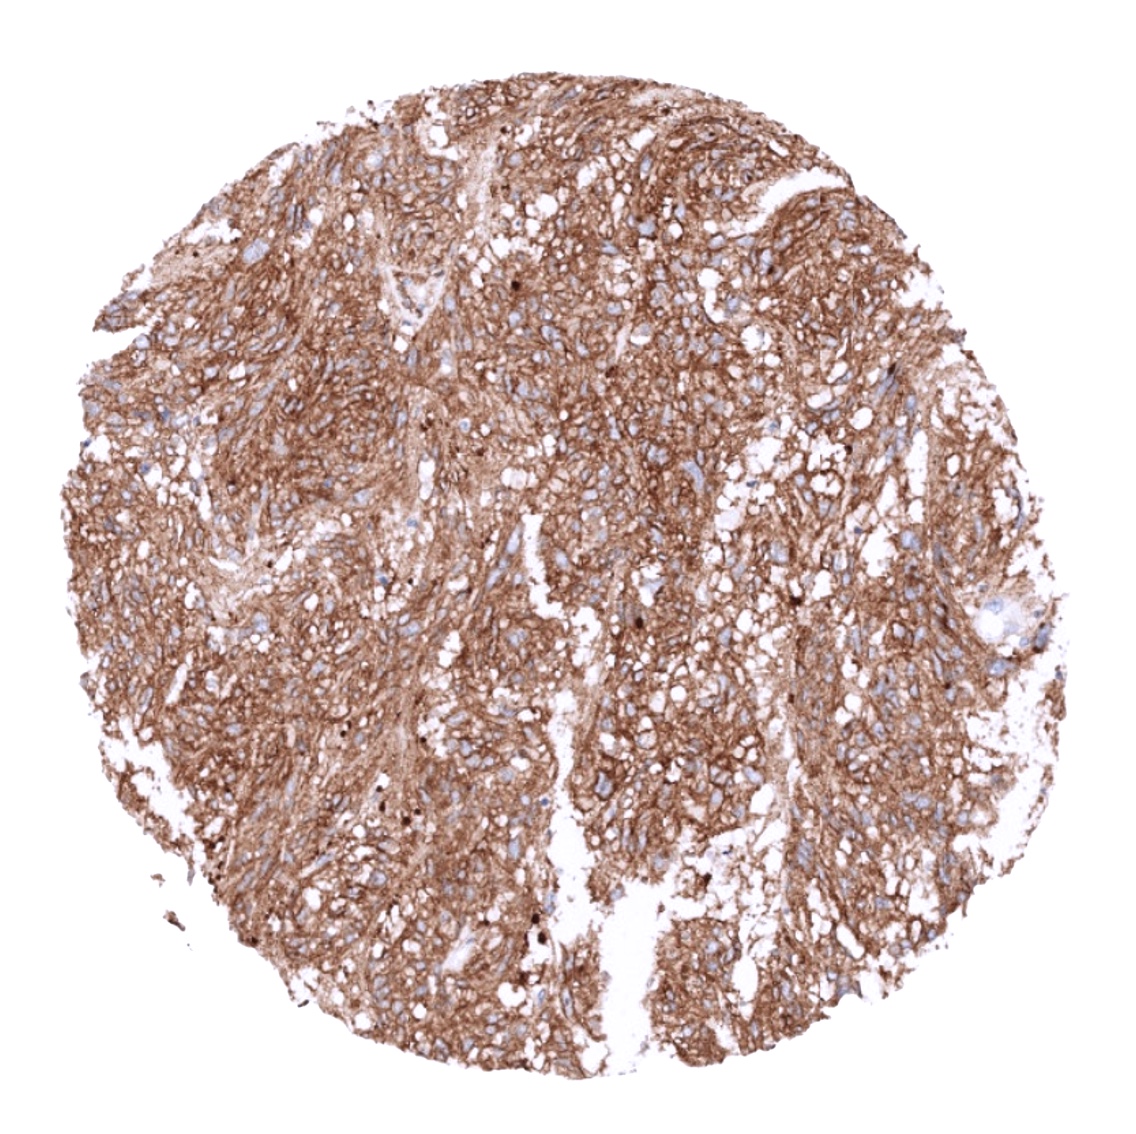
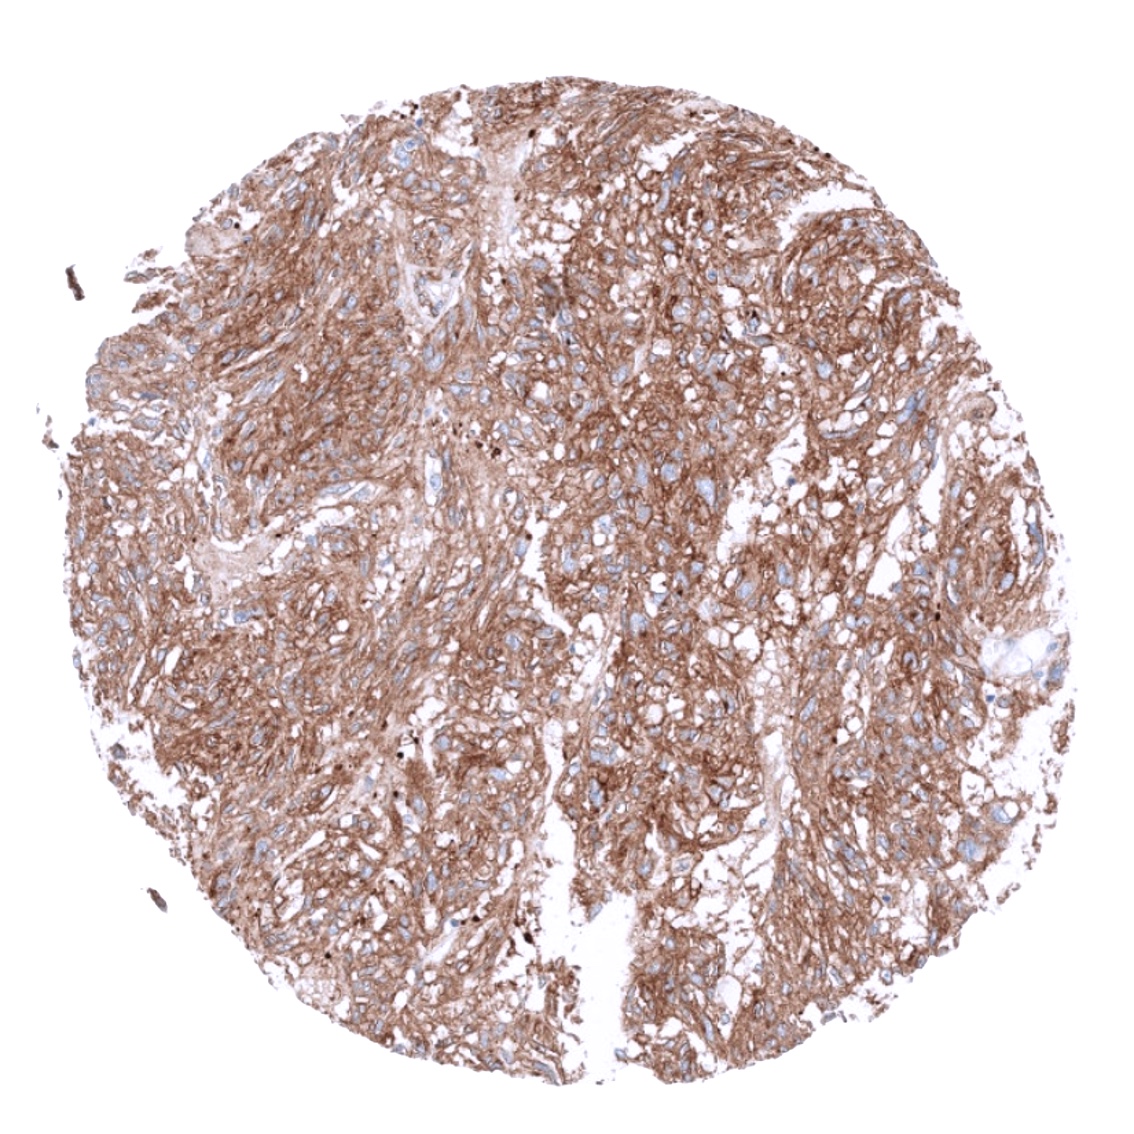
The highest staining levels are seen in gastrointestinal stromal tumors (GIST) but distinct membranous staining at various – sometimes even high – levels can also be observed in a variety of other tumors, for example in squamous cell carcinomas of various origins, salivary gland tumors, ovarian cancer, endometrial carcinoma, as well as adenocarcinomas of esophagus, pancreas, stomach and the colorectum.
Detailed data on Dog1 staining by MSVA-201M obtained from an analysis of 599 pancreatic cancers in a tissue microarray format and in 12 cases of pancreatitis on large tissue sections have recently been published by Jansen et al. “DOG1 is commonly expressed in pancreatic adenocarcinoma but unrelated to cancer aggressiveness”
The TCGA findings on Dog-1 RNA expression in different tumor categories have been summarized in the Human Protein Atlas.
Compatibility of Antibodies
DOG1 (MSVA-201M) publication summary
Papers used for data compilation:
-Jansen et al. DOG1 expression is common in human tumors: A tissue microarray study on more than 15,000 tissue samples Pathology – Research and Practice Volume 228: December 2021
-Jansen et al. “DOG1 is commonly expressed in pancreatic adenocarcinoma but unrelated to cancer aggressiveness”PeerJ: 2021; 9: e11905
In these two studies, a total of 13896 tumors were analyzed from 121 different tumor categories by using the following protocol: Heat-induced antigen retrieval for 5 minutes in an autoclave at 121°C in pH 7.8 Target Retrieveal Solution buffer. MSVA-201M at a dilution of 1:150 at 37°C for 60 minutes. Visualization of bound antibody by the EnVision Kit (Dako, Agilent). This protocol was also used for all stainings depicted in our tumor and normal tissue galleries.
At least one case with a positive DOG1 immunostaining was seen in 67 (55,4%) and at least one case with a strong DOG1 immunostaining was seen in 34 (28%) of 121 tumor categories. The distribution of positive staining results is shown in an “organ-systematic” and in a “ranking order” figure below (images based on a compilation of data from Jansen et al.). Results on possible associations with histopathological and clinical parameters of tumor aggressiveness are also summarized below (table based on data from Jansen et al.).
Authors conclusions on diagnostic utility with respect to the distinction of benign versus malignant (Jansen et al.)
- Given that DOG1 staining was absent in normal pancreas and only weak to moderate (and focal) in 4 of 12 cases with pancreatitis while 34% of pancreatic adenocarcinomas showed a moderate to strong DOG1 positivity, the authors conclude that DOG1 positivity in pancreatic biopsies is an argument in favor of adenocarcinoma of the pancreas.
Authors conclusions on diagnostic utility with respect to the distinction of different tumor entities (Jansen et al.):
- DOG1 expression is not specific for gastrointestinal stromal tumor (GIST)
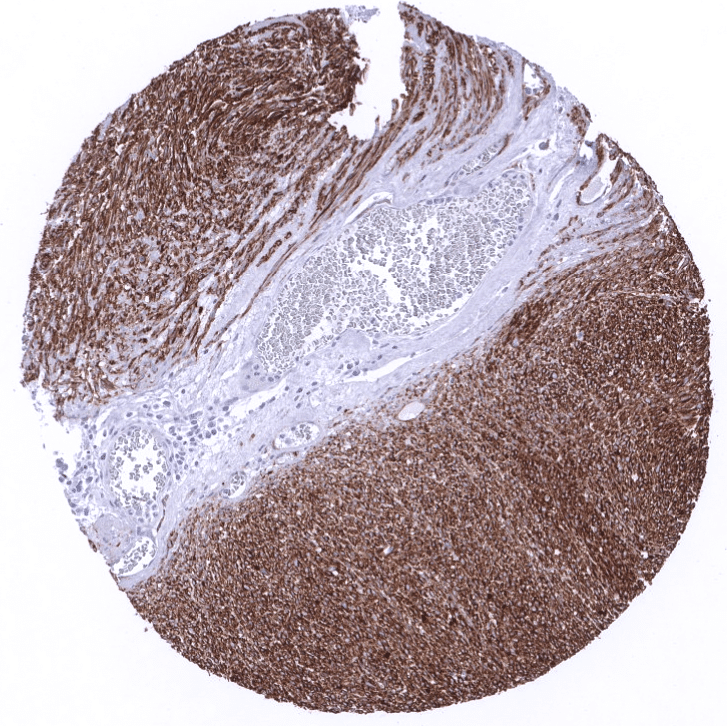
- A high level DOG1 expression in spindle cell tumors is highly suggestive of GIST (but it can – rarely – also occur in leiomyomatous tumors)
- A high DOG1 expression can occur in various cancer types. These especially include cancers of the esophagus, pancreas, colon as well as squamous cell carcinomas of different origins.
Authors conclusions on prognostic/predictive role of PLAP expression (Jansen et al.):
- The complete lack of associations between DOG1 expression levels and histopathological parameters of cancer aggressiveness or clinical outcome data in carcinomas of the breast, urinary bladder, ovary, endometrium, stomach, pancreas, and the thyroid gland argues against a strong and clinically relevant prognostic role of DOG1 expression in cancer.
- Dog-1 Staining in tumors “organ-specific” with antibody MSVA-201M

2. Dog-1 Staining in tumors “ranking order” by positivity with antibody MSVA-201M

3. Table Clinico-pathological associations described by Jansen et al. (p-value)

Protocol Recommendations
IHC users have different preferences on how the stains should look like. Some prefer high staining intensity of the target stain and even accept some background. Others favor absolute specificity and lighter target stains. Factors that invariably lead to more intense staining include higher concentration of the antibody and visualization tools, longer incubation time, higher temperature during incubation, higher temperature and longer duration of the heat induced epitope retrieval (slide pretreatment). The impact of the pH during slide pretreatment has variable effects and depends on the antibody and the target protein.
All images and data shown here and in our image galleries are obtained by the manual protocol described below. Other protocols resulting in equivalent staining are described as well.
Manual protocol
Freshly cut TMA sections should be used. Heat-induced antigen retrieval for 5 minutes in an autoclave at 121°C in pH 9,0. MSVA-201M antibody specific against DOG1 protein is applied at 37°C for 60 minutes at a dilution of 1:150. Visualization of bound antibody by the EnVision Kit (Dako, Agilent) according to the manufacturer’s directions.

Agilent / Dako – Autostainer Link 48
Pretreatment in PT-Link for 30 minutes at 95°C (pH high); FLEX peroxidase blocking for 5 minutes (room temperature), MSVA-201M 1:800 for 20 minutes (room temperature), FLEX+ mouse/rabbit (LINKER) for 15 minutes (room temperature), horseradish peroxidase (HRP) for 20 minutes (room temperature), FLEX DAB+Sub-Chromo for 10 minutes (room temperature), FLEX hematoxylin for 5 minutes (room temperature).

These images reflect stainings by the protocol described above. It is of note that a comparable staining result can also be obtained by different protocols. In general, a longer pretreatment, a longer incubation time of the primary antibody, a higher antibody concentration, and a longer incubation time of FLEX+LINKER result in stronger staining, potentially at the cost of more background staining. Modifications of the protocol with a strengthening effect on staining intensity in combination with changes of other parameters that result in lower staining intensity can result in a comparable result as shown above.
Leica – BOND RX
Dewax at 72°C for 30 seconds; Pretreatment in Bond Epitope Retrieval Solution (ER2 – EDTA pH9) for 40 minutes at 100°C; Peroxidase blocking for 5 minutes (room temperature), MSVA-201M 1:800 for 20 minutes (room temperature), Post primary (rabbit anti mouse) for 8 minutes (room temperature), Polymer (goat anti rabbit) for 8 minutes (room temperature), mixed DAB refine for 10 minutes (room temperature), hematoxylin for 5 minutes (room temperature).
These images reflect stainings by the protocol described above. It is of note that a comparable staining result can also be obtained by different protocols. In general, a longer pretreatment, a longer incubation time of the primary antibody, a higher antibody concentration, a higher temperature during incubation, and a longer incubation time of Post primary and or the Polymer result in stronger staining, potentially at the cost of more background staining. Modifications of the protocol with a strengthening effect on staining intensity in combination with changes of other parameters that result in lower staining intensity can result in a comparable result as shown above.
Roche – Ventana Discovery ULTRA
Pretreatment for 64 minutes at 100°C (pH 8,4); CM peroxidase blocking for 12 minutes (room temperature), MSVA-201M 1:150 for 20 minutes at 36°C, secondary antibody (anti-mouse HQ) for 12 minutes at 36°C, anti-HQ HRP for 12 minutes at room temperature, DAB at room temperature, hematoxylin II at room temperature for 8 minutes, bluing reagent at room temperature for 4 minutes.
These images depict staining results obtained by the protocol described above. It is of note, that the Ventana machines generally require higher antibody concentrations than other commonly used autostainers because the antibodies are automatically diluted during the procedure. Various other protocols can result in an identical result as shown above. A longer pretreatment, a longer incubation time of the primary antibody, a higher antibody concentration, a higher temperature during incubation, and a longer incubation time of secondary antibody and or the anti-HQ HRP result in stronger staining, potentially at the cost of more background staining.
Impact of pH


MSVA-201M results in strongest staining if pH9,0 is used for slide pretreatment. pH7,8 is acceptable but lower pH results in a significant reduction of sensitivity.
Potential pitfalls
- Leiomyomas can be colonized by DOG1+ Cajal cells, a finding that can be mistaken for GIST
Potential Research Applications
- The diagnostic utility of DOG1 IHC should be investigated in a large cohort of tumors from different entities.
- The clinical significance of DOG expression levels in GIST deserves further investigation.
- The clinical significance of DOG1 expression in non-GIST tumors is unknown.
- The cause of DOG1 overexpression is unknown. As DOG1 lies in a frequently amplified region of the genome (11q13), amplification might play a role.
Evidence for Antibody Specificity in IHC
There are two ways how the specificity of antibodies can be documented for immunohistochemistry on formalin fixed tissues. These are: 1. Comparison with a second independent method for target expression measurement across a large number of different tissue types (orthogonal strategy), and 2. Comparison with one or several independent antibodies for the same target and showing that all positive staining results are also seen with other antibodies for the same target (independent antibody strategy).
Orthogonal validation was done by comparison of the MSVA-201M immunostaining data with data from three independent RNA screening studies, including the Human Protein Atlas (HPA) RNA-seq tissue dataset, the FANTOM5 project, and the Genotype-Tissue Expression (GTEx) project, which are all summarized in the human protein atlas. For the antibody MSVA-201M specificity is suggested by the significant immunostaining in the organs with highest RNA expression including, salivary glands, seminal vesicle, epididymis, and the liver. However, using MSVA-201M, DOG1 immunostaining can also be seen in several tissues without unequivocal RNA expression. These tissues include interstitial cells of Cajal, stomach epithelial cells, gallbladder epithelium, colonic mucosa, fallopian tube mucosa, myoepithelial cells of the breast, thyroid follicles, amnion cells, endometrium, and endocervical epithelium. These DOG1 positive structures constitute small subsets of the total amount of cells in these tissues/organs and may have been largely underrepresented in RNA analyses and may therefore have remained undetected.
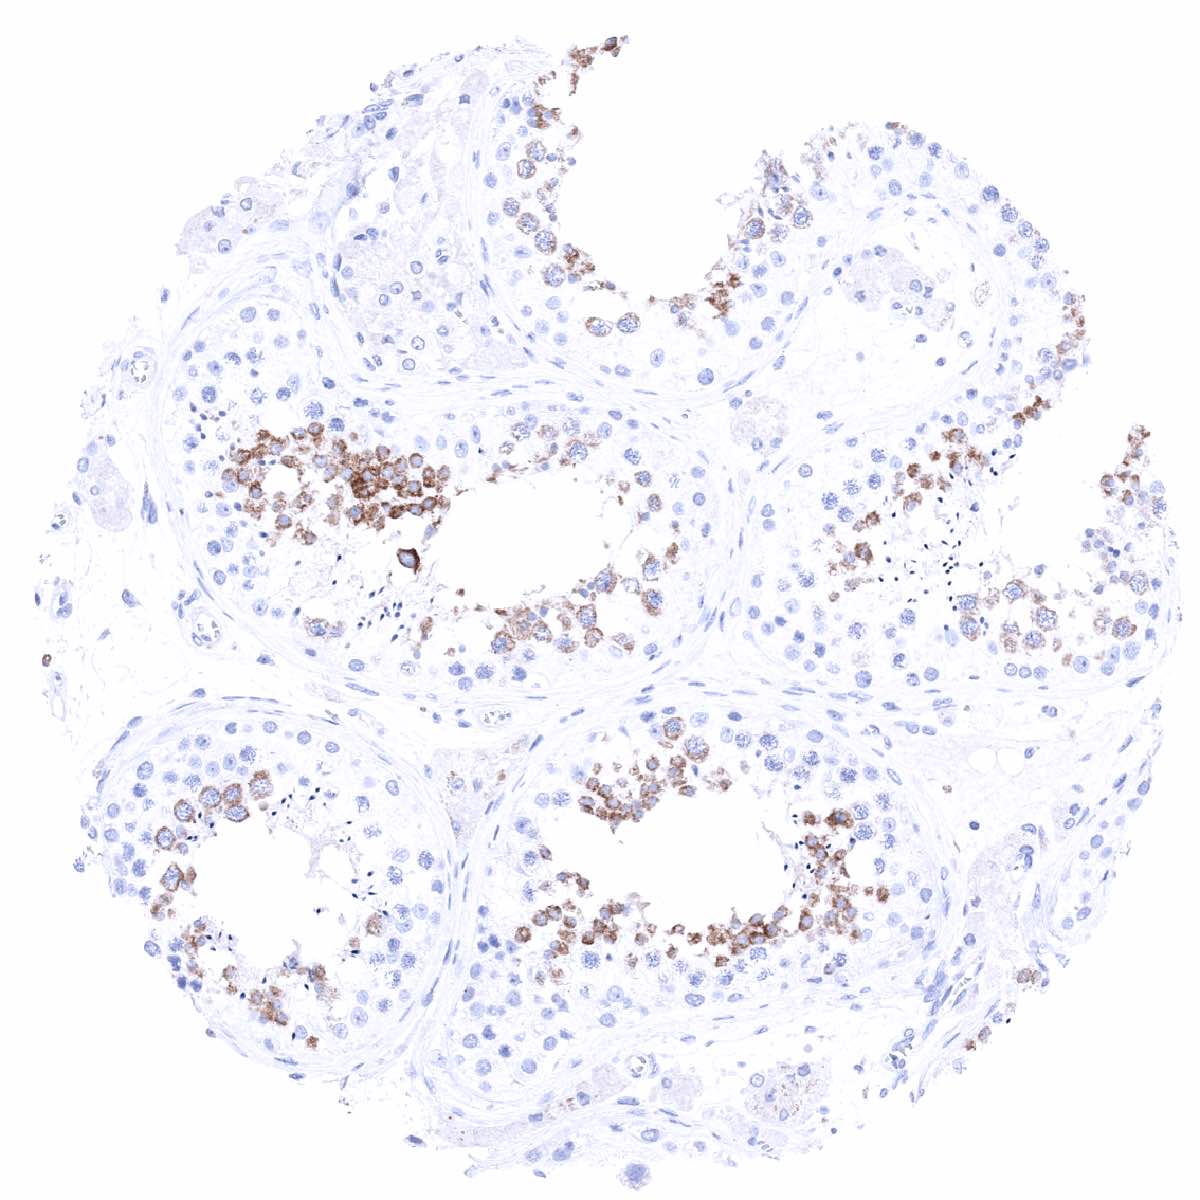
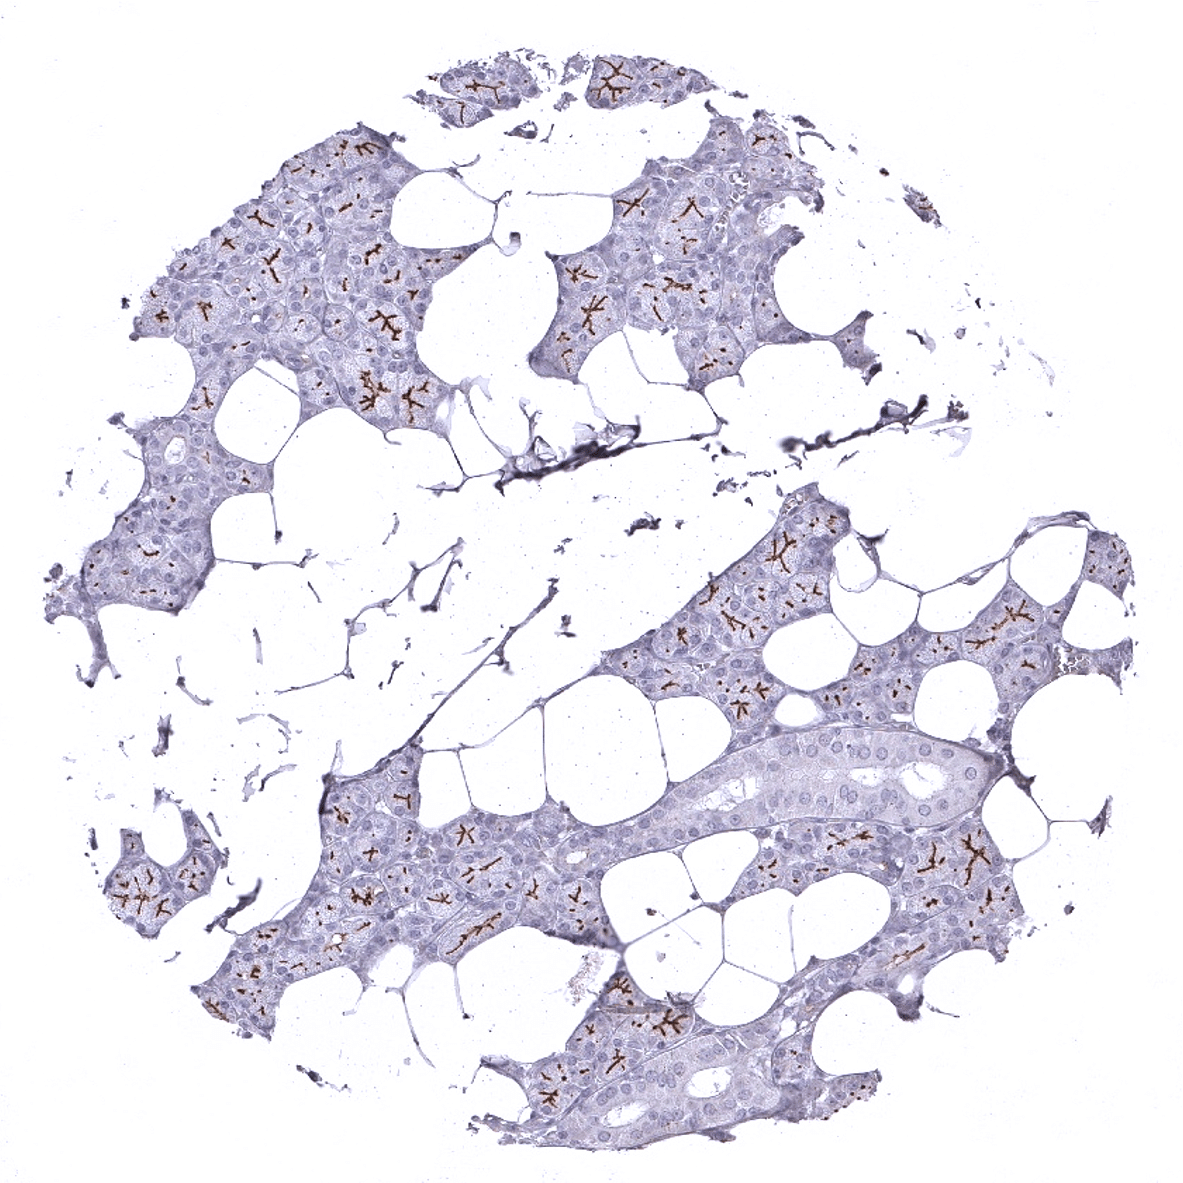
Comparison of antibodies: True DOG1 expression in all these cell types with DOG1 positivity by MSVA-201M but lacking documented RNA expression in their respective organs was suggested by a comparison of the MSVA-201M staining with data obtained by an independent commercial antibody (“validation antibody”). Images comparing MSVA-201M and the independent “validation antibody” are shown below. “Independence” of the validation antibody is confirmed by its strong staining of spermatocytes which is not detected by MSVA-201M and which is thus considered a (tolerable) cross-reactivity of the validation antibody.
Antibody Comparison: MSVA-201M vs another commercially available DOG1 antibody called “Validation Antibody”