Why is antibody validation different for antibodies in immunohistochemistry?
Formalin fixation exerts a profound impact on the three-dimensional structure of proteins and the accessibility of epitopes. By a process called “crosslinking” proteins are fixed to adjacent molecules which can be other proteins, DNA and other molecules. As a result, epitopes that are targeted by antibodies may be masked and new antibody binding sites can evolve. The process of cross-linking can partially be reversed by heat induced epitope retrieval (HIER).
Because formalin fixation represents such a harsh manipulation of proteins, traditional methods used for evaluating antibodies on unfixed “perfect” proteins such as Western blot, ELISA, protein microarrays are of little use, even if they are applied to very well selected experimental control materials such as “KO-cell lines”.
Antibodies intended for use on formalin fixed tissues must be specifically validated on formalin fixed tissues. According to the International Working Group for Antibody Validation (IWGAV), there are only two ways how the specificity of antibodies can be documented for immunohistochemistry on formalin fixed tissues. These are:
- Comparison with a second independent method for target expression measurement across a large number of different tissue types (orthogonal strategy), and
- Comparison with one or several independent antibodies for the same target and showing that all positive staining results are also seen with other antibodies for the same target (independent antibody strategy).
All MSVA antibodies are validated by both “orthogonal validation” and “independent antibody validation”.
For orthogonal validation, data are used from the normal tissue expression RNA databases “the Human Protein Atlas (HPA) RNA-seq tissue dataset”, the FANTOM5 project, and the Genotype-Tissue Expression (GTEx) project, which are all summarized in the Human Protein Atlas.
For “independent antibody validation” multiple different antibodies are always used – if possible – including established commercial (IVD/IVDR) antibodies.
More Information about the MSVA Validation
Antibody quality is a key issue for multiplex fluorescence immunohistochemistry
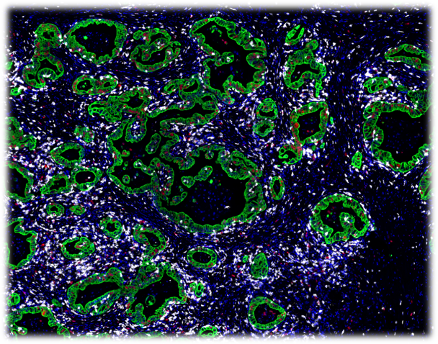
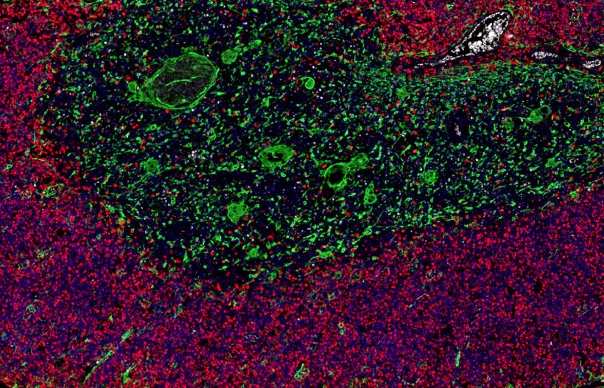
Multiplex fluorescence immunohistochemistry (mfIHC) allows the application of multiple antibodies to one tissue slide. Currently available equipment enables the simultaneous analysis of 4 (Versa 8, Leica), 6 (Vectra Polaris, AKOYA) and more than 50 antibodies (CODEX , AKOYA). Sophisticated analysis frameworks utilize artificial intelligence for specific cell type identification defined by a combination of positive and negative antibody stainings as well as the spatial relationship between these cell types. Because of the high number of different “colors” on each stained slide and impaired morphologic cell type distinction in fluorescence imaging, visual quality control of individual antibodies becomes impossible. Non-specific or cross-reactive antibody staining of one or several antibodies used in a multicolor panel can severely contaminate the data and conclusions drawn from experiments. High-quality antibodies resulting in minimal non-specific binding (signal to noise ratio) and a documented lack of cross-reactivity are therefore pivotal for experimental success. Hence, the quality of the antibodies assembled in a mfIHC panel is pivotal for studies of the immune tumor microenvironment.
Examples of mfIHC images containing a variable number of antibodies are shown below (Images: Courtesy of Dr. Niclas C. Blessin)