
395,00 € – 1.495,00 €
Product details
Synonyms = Cell surface glycoprotein Trop-2; Membrane Component Chromosome 1, Surface Marker 1 (M1S1); Pancreatic Carcinoma Marker Protein GA733-1; TROP2; Tumor-Associated Calcium Signal Transducer 2 (TACSTD2)
Antibody type = Recombinant Rabbit monoclonal / IgG
Clone = MSVA-733R
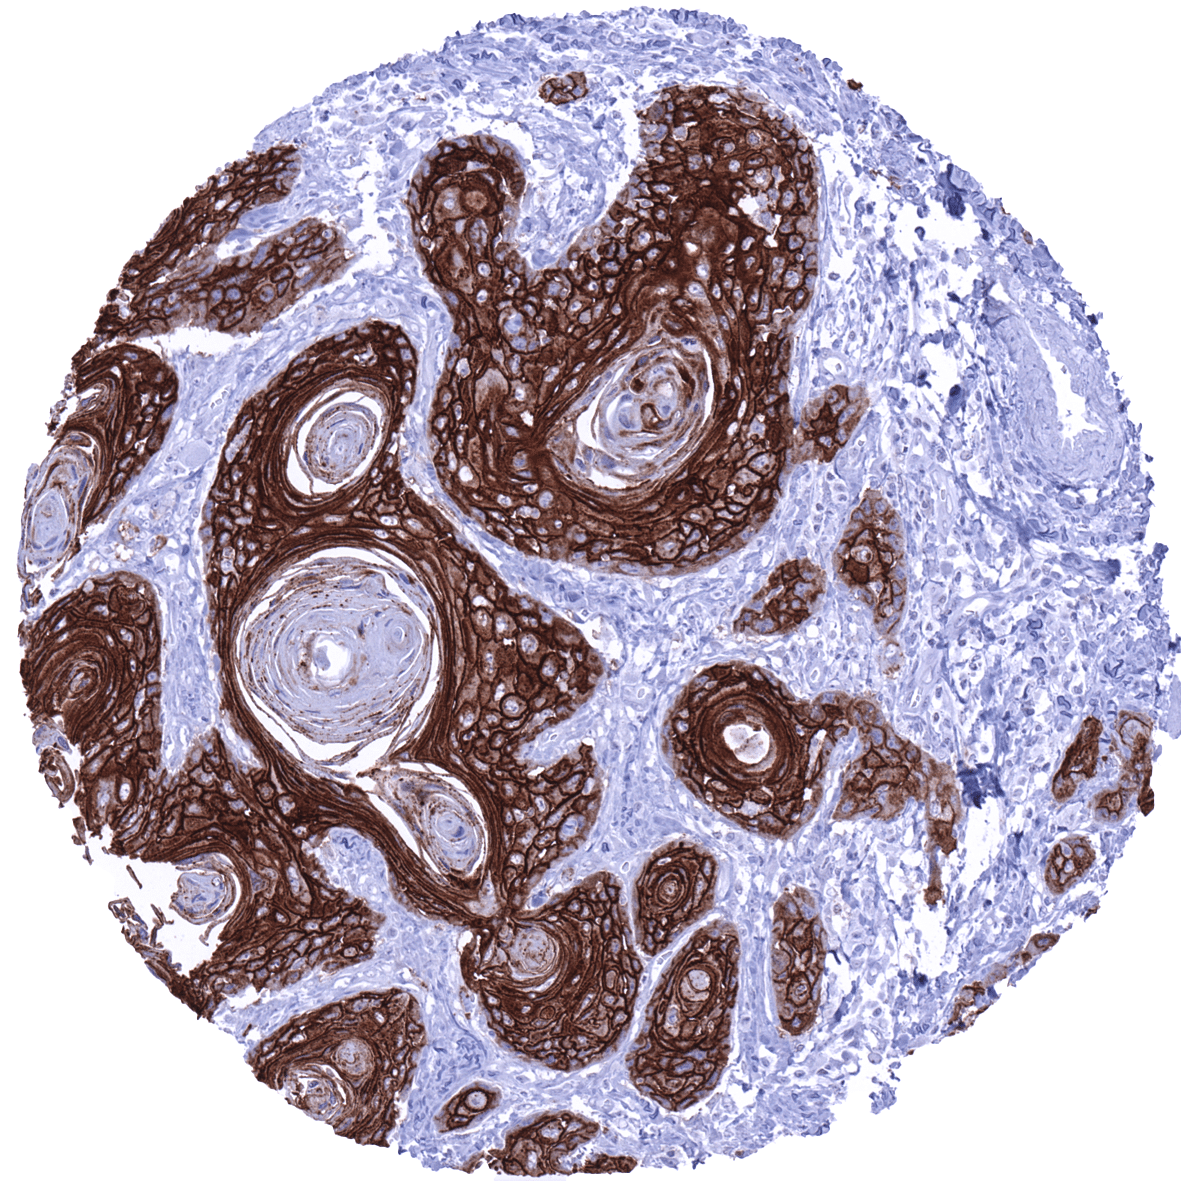
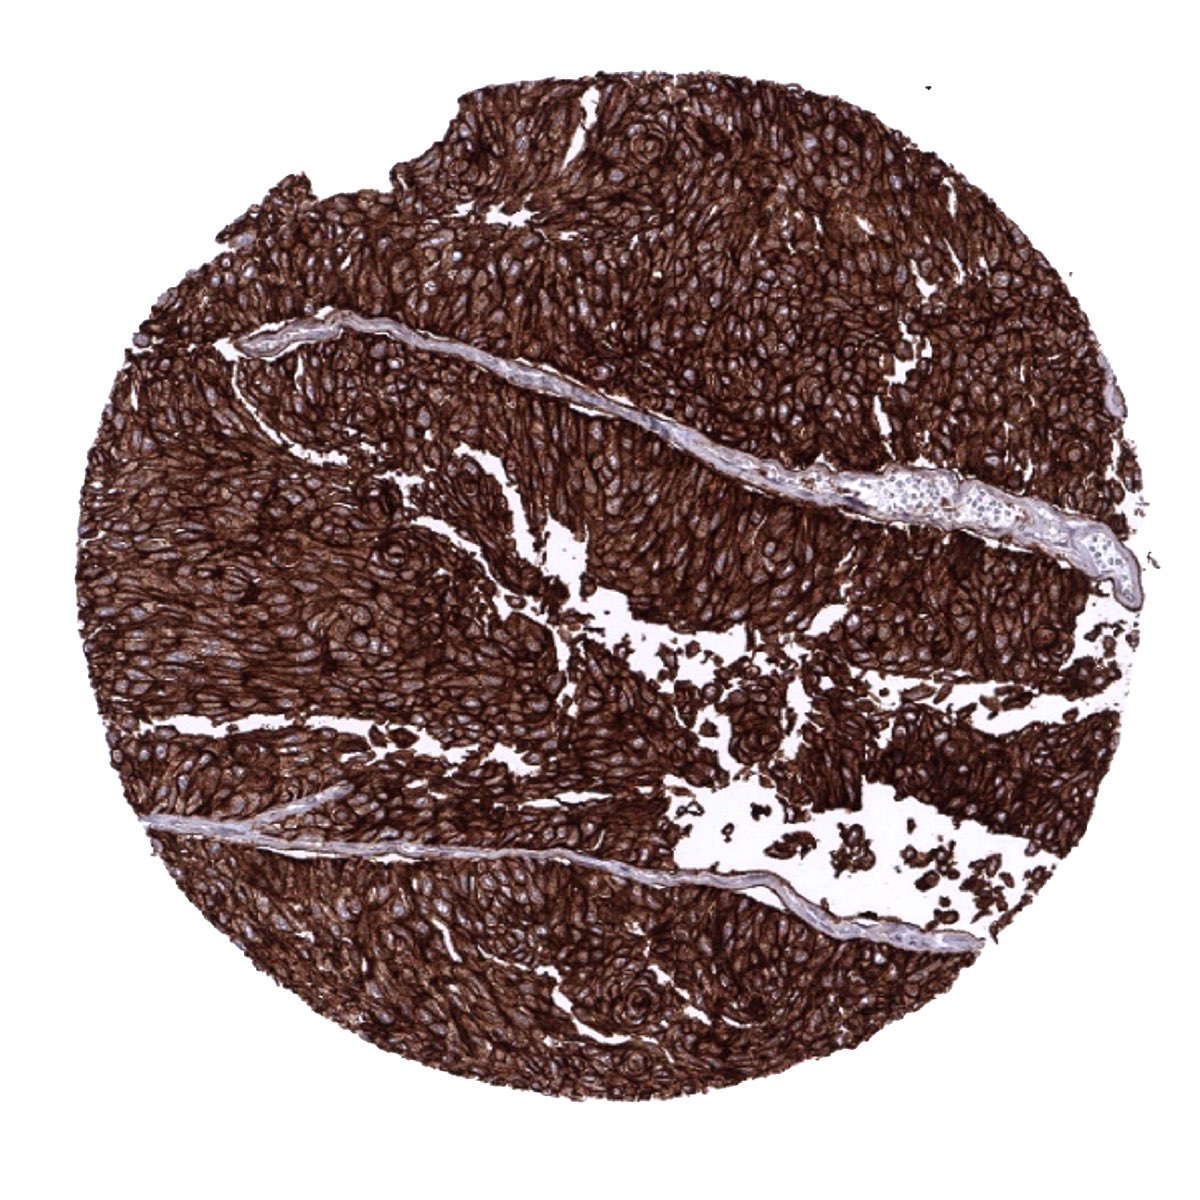
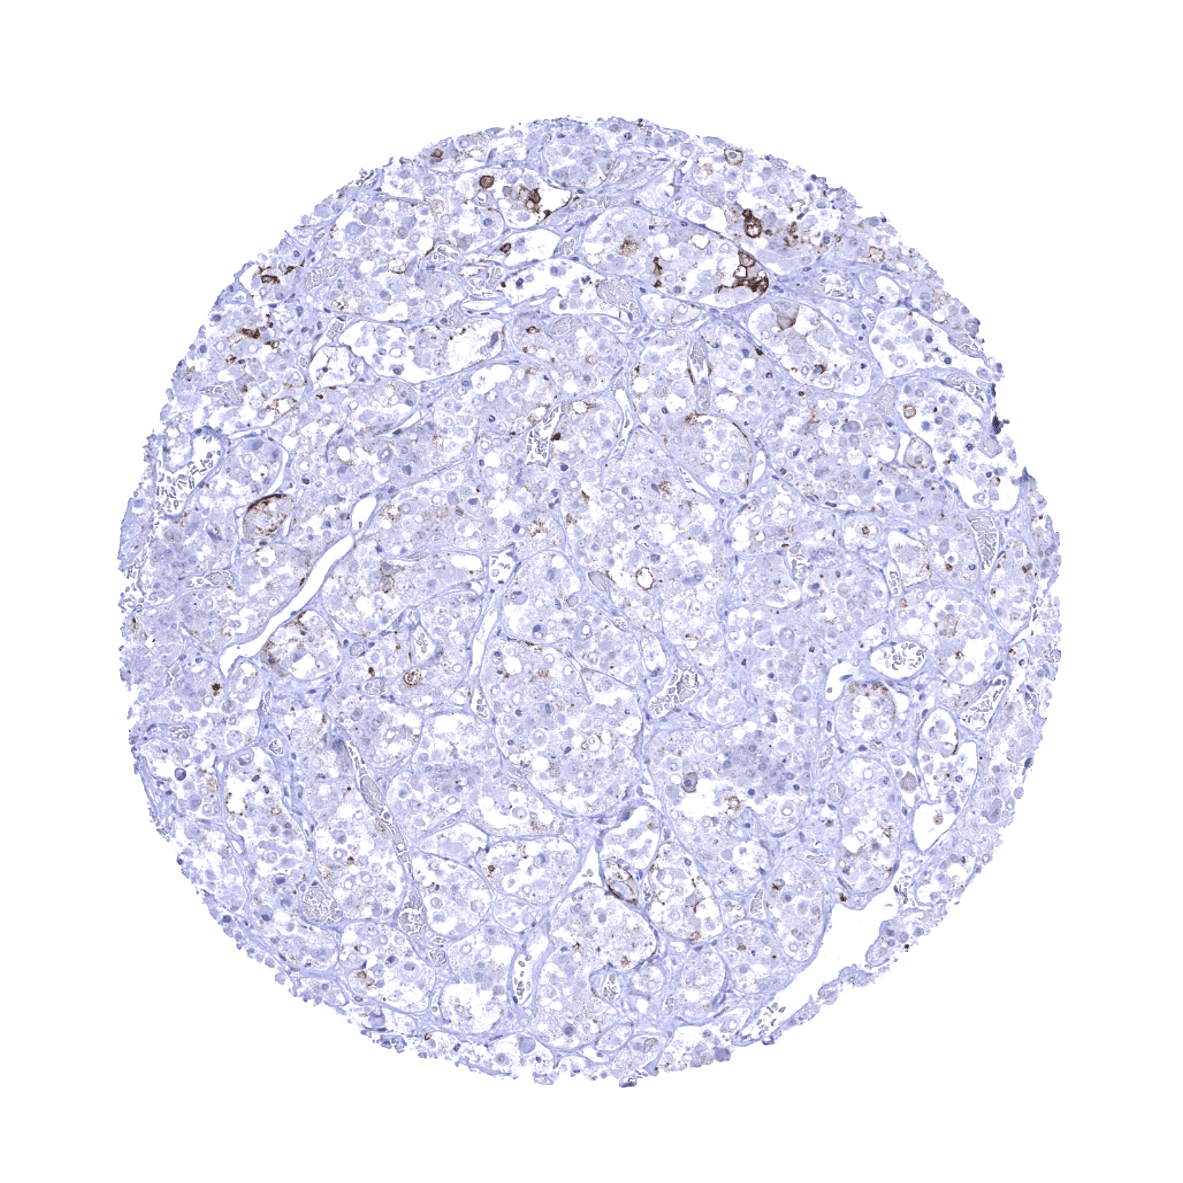
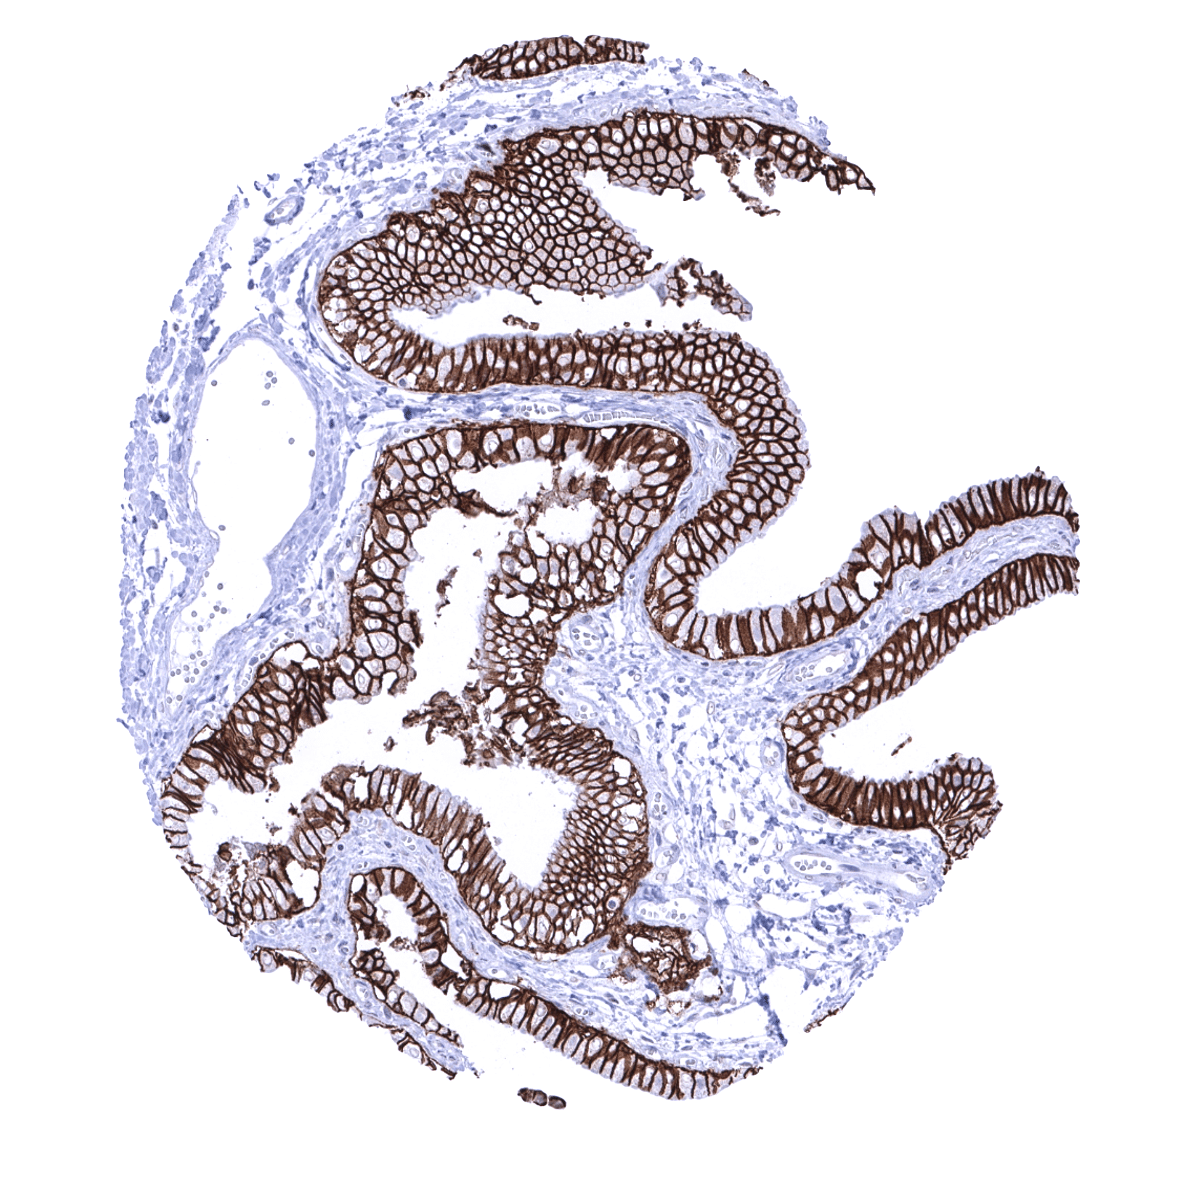
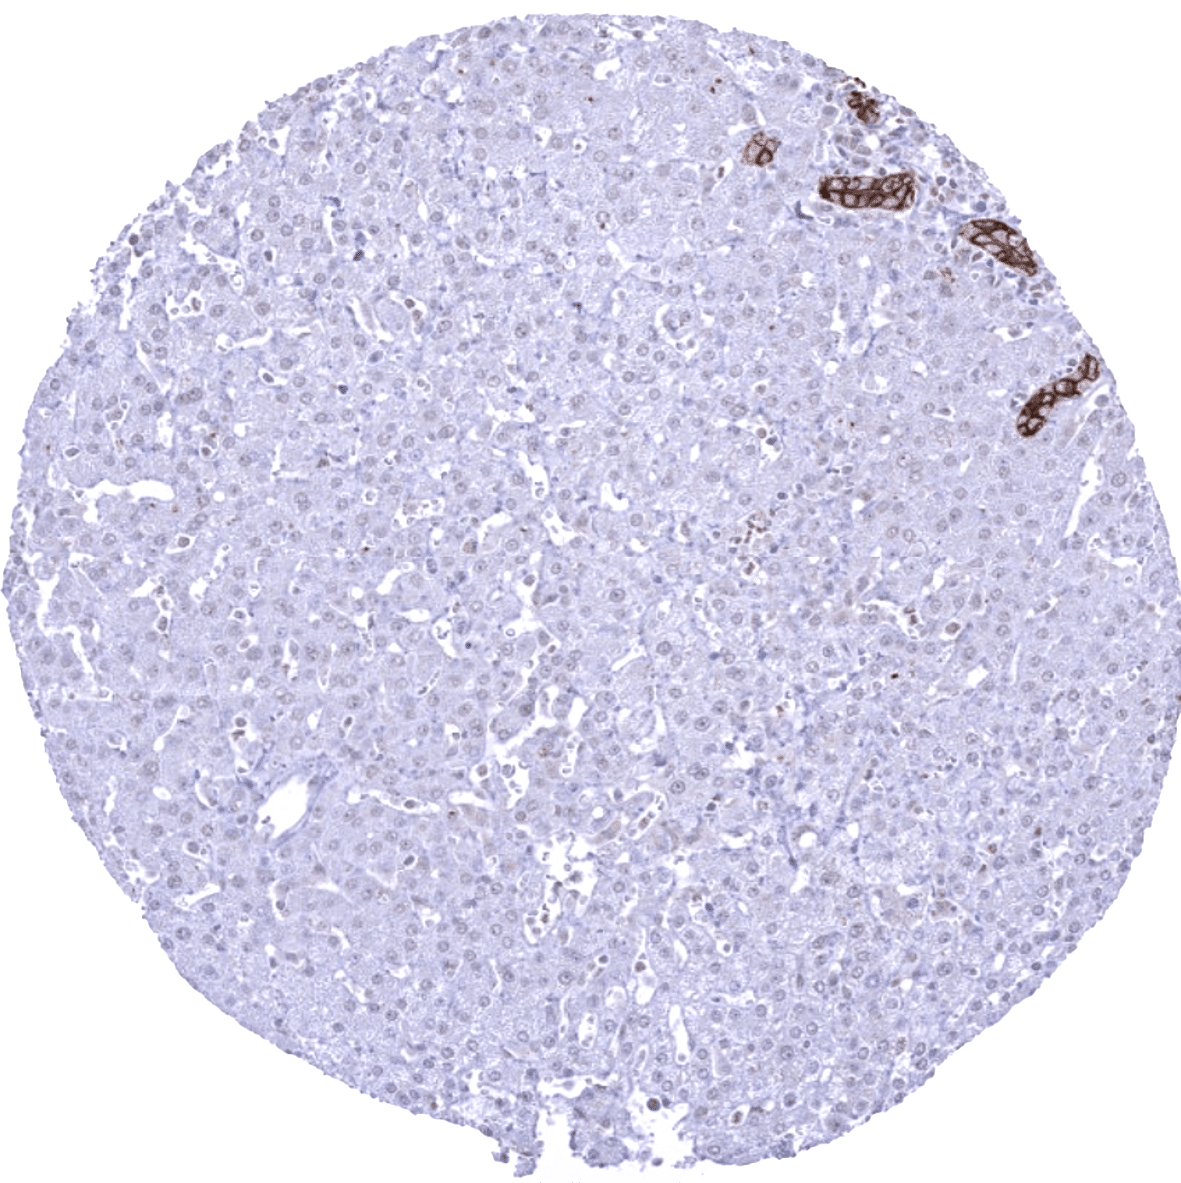
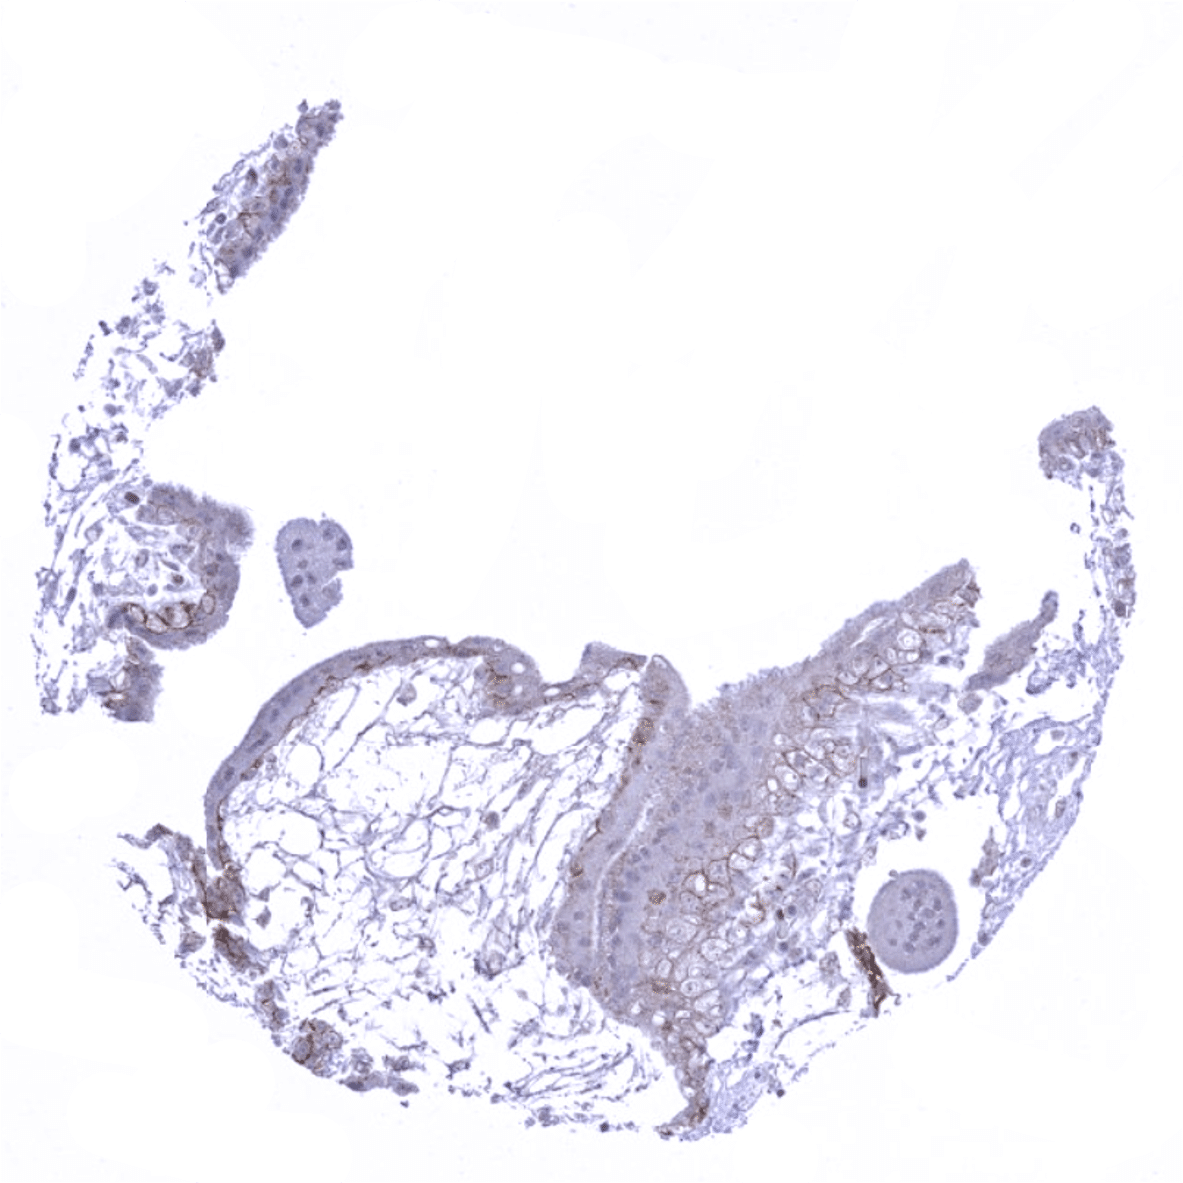
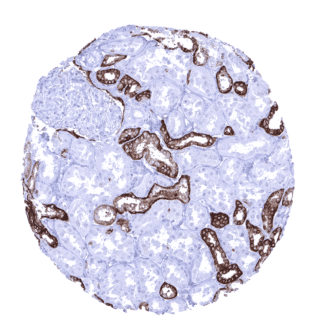
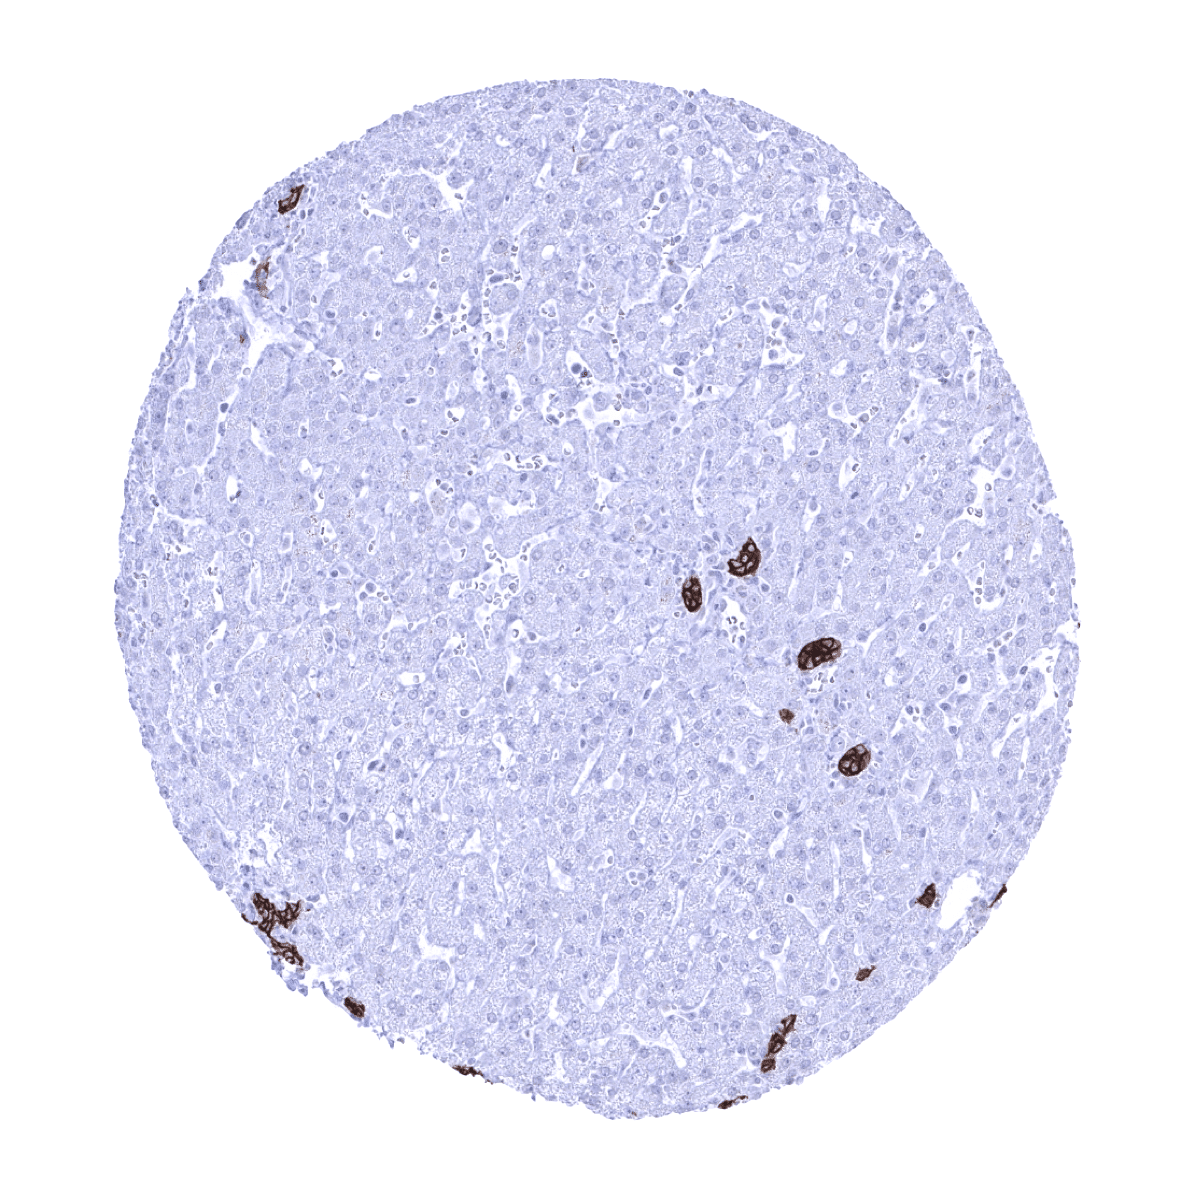
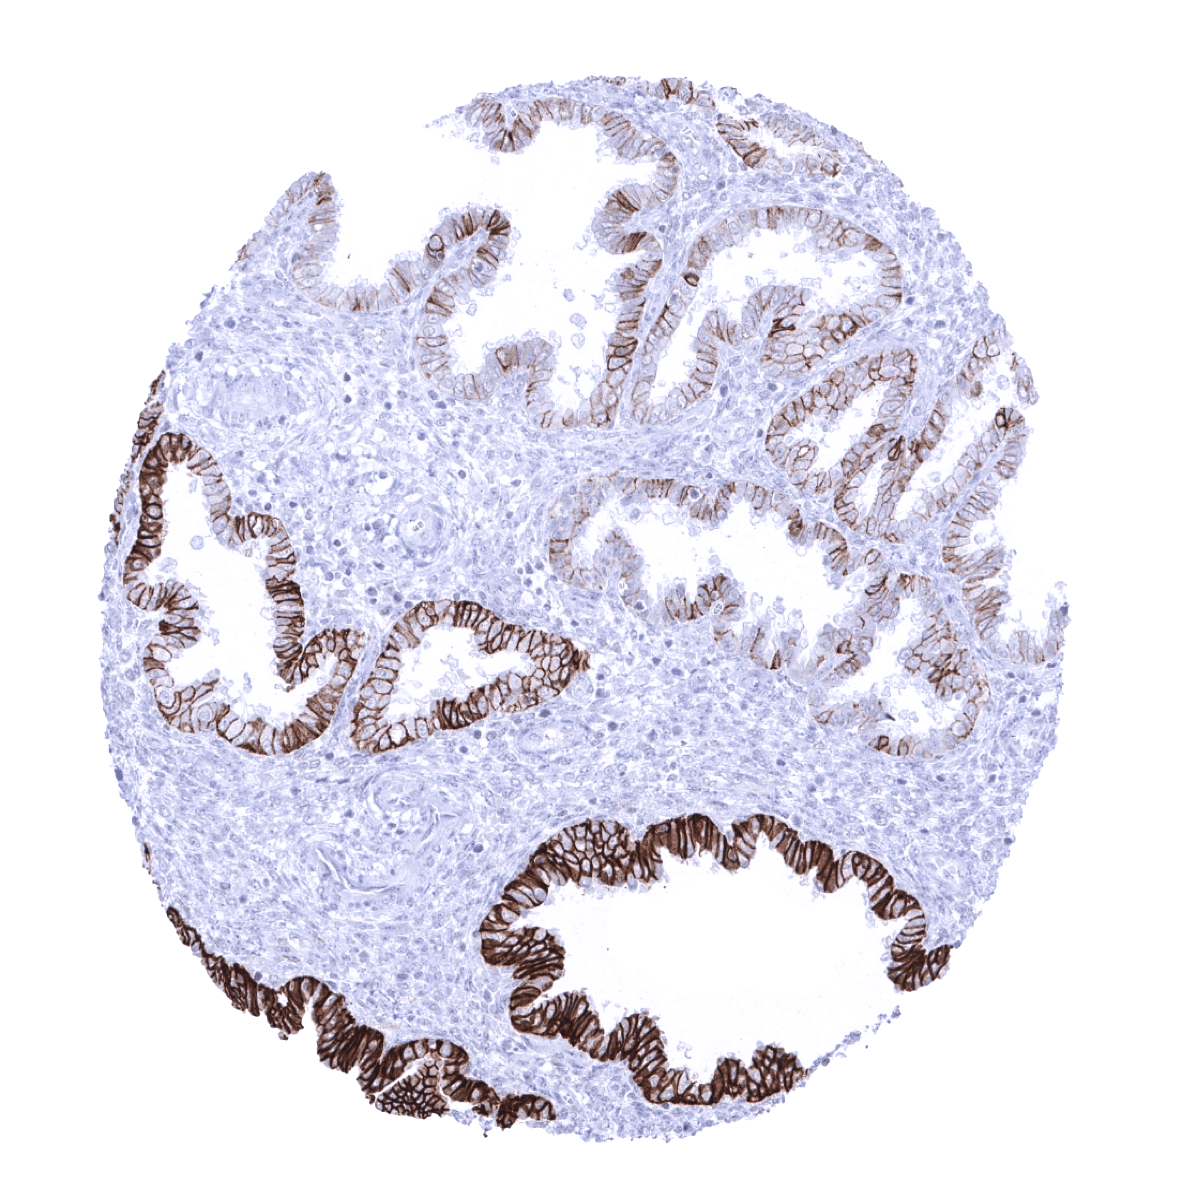
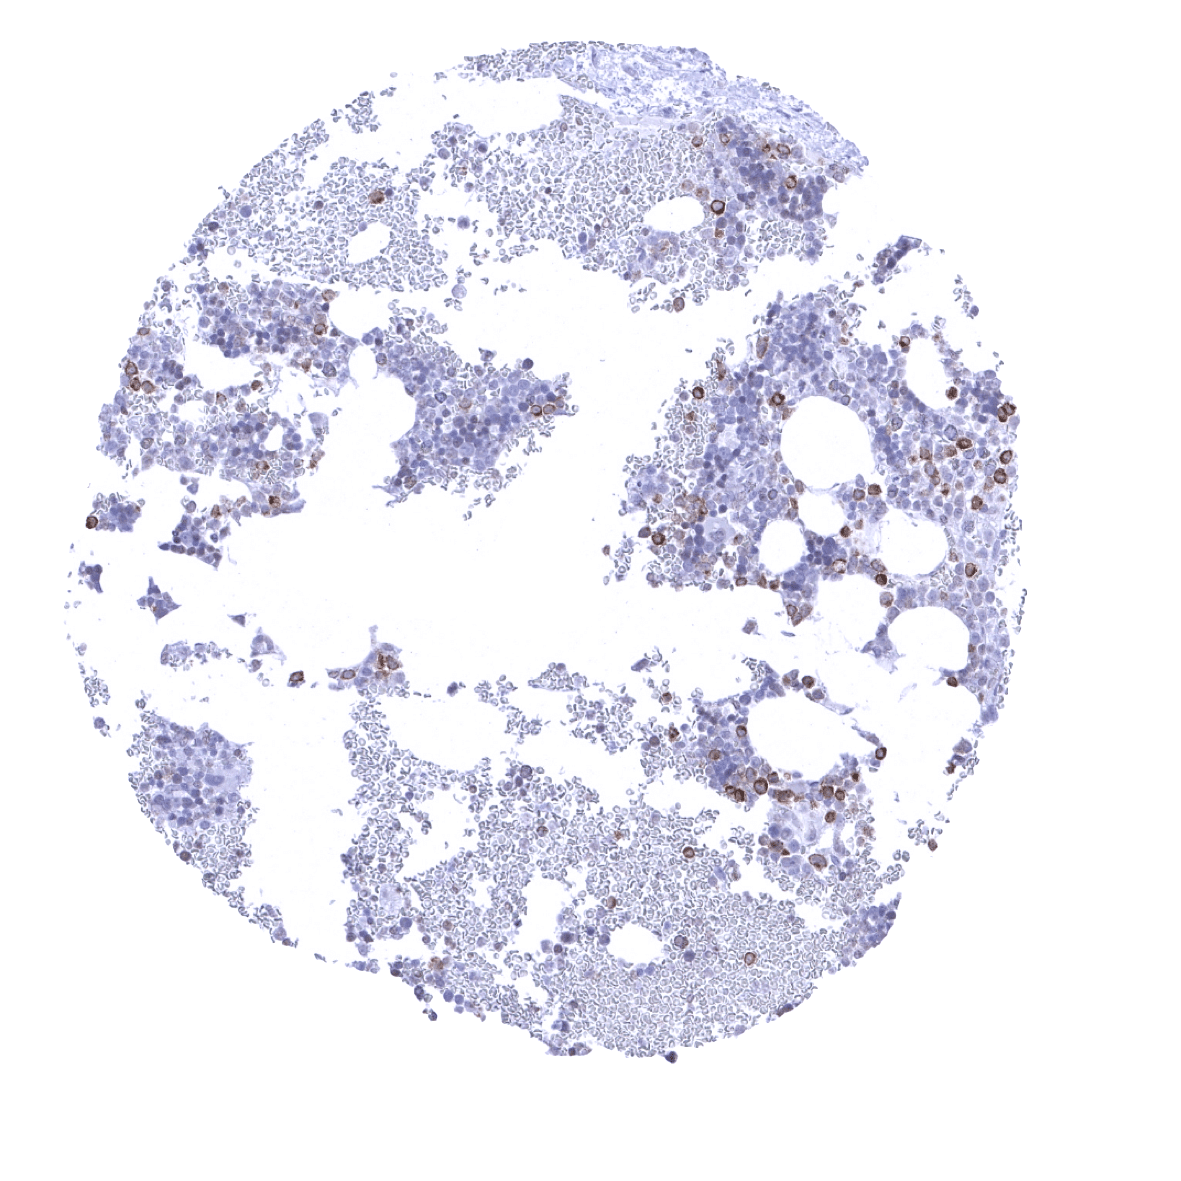
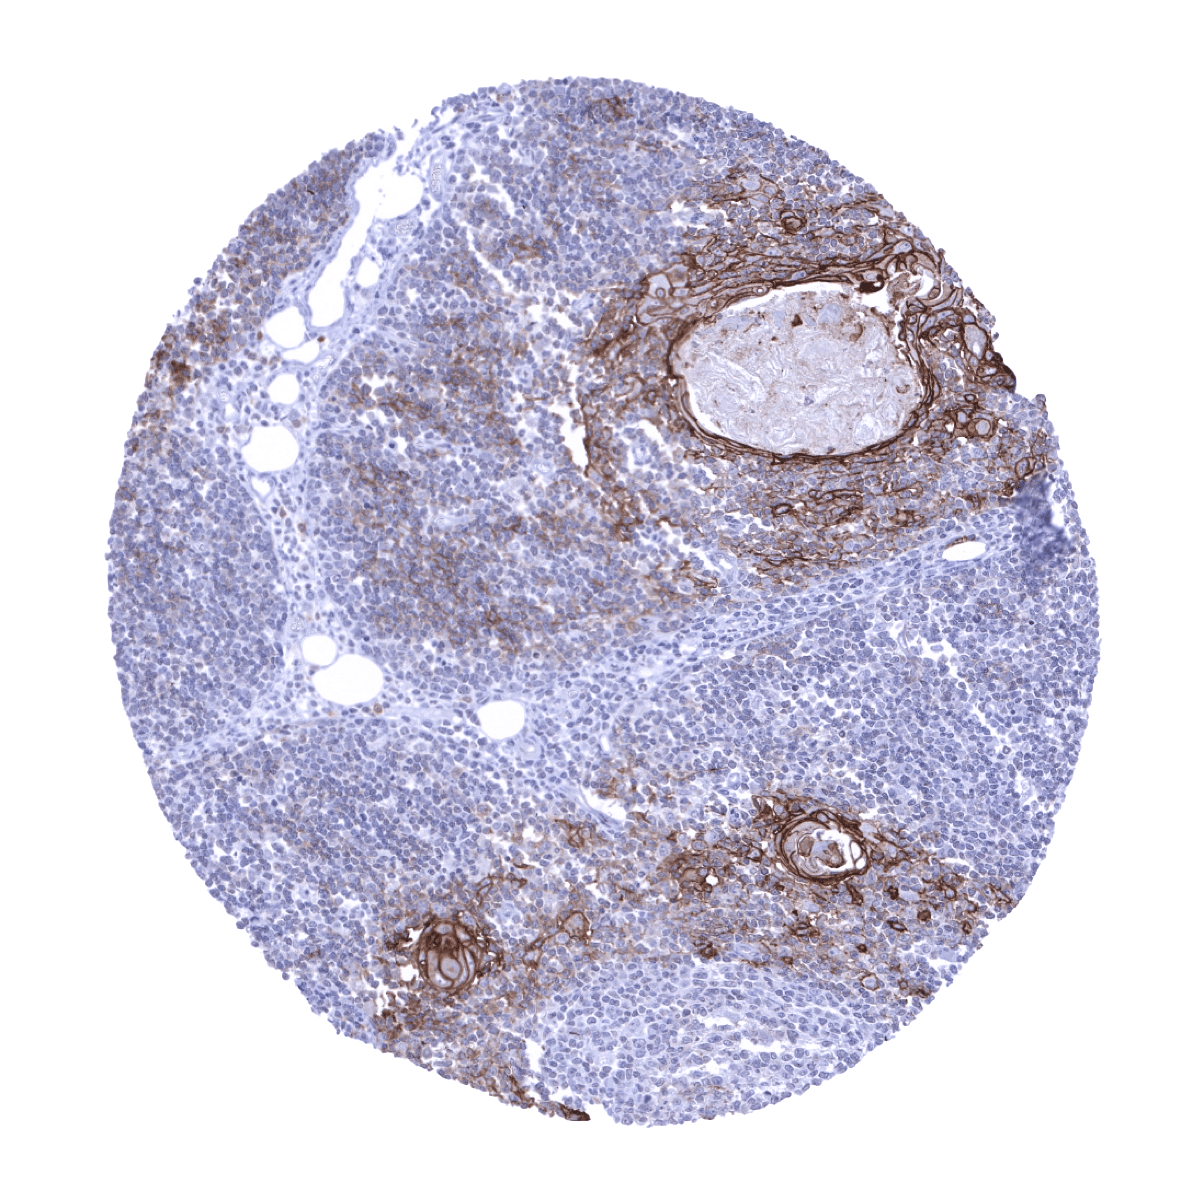
Positive control = Liver: A strong membranous Trop-2 immunostaining should be seen in bile ducts.
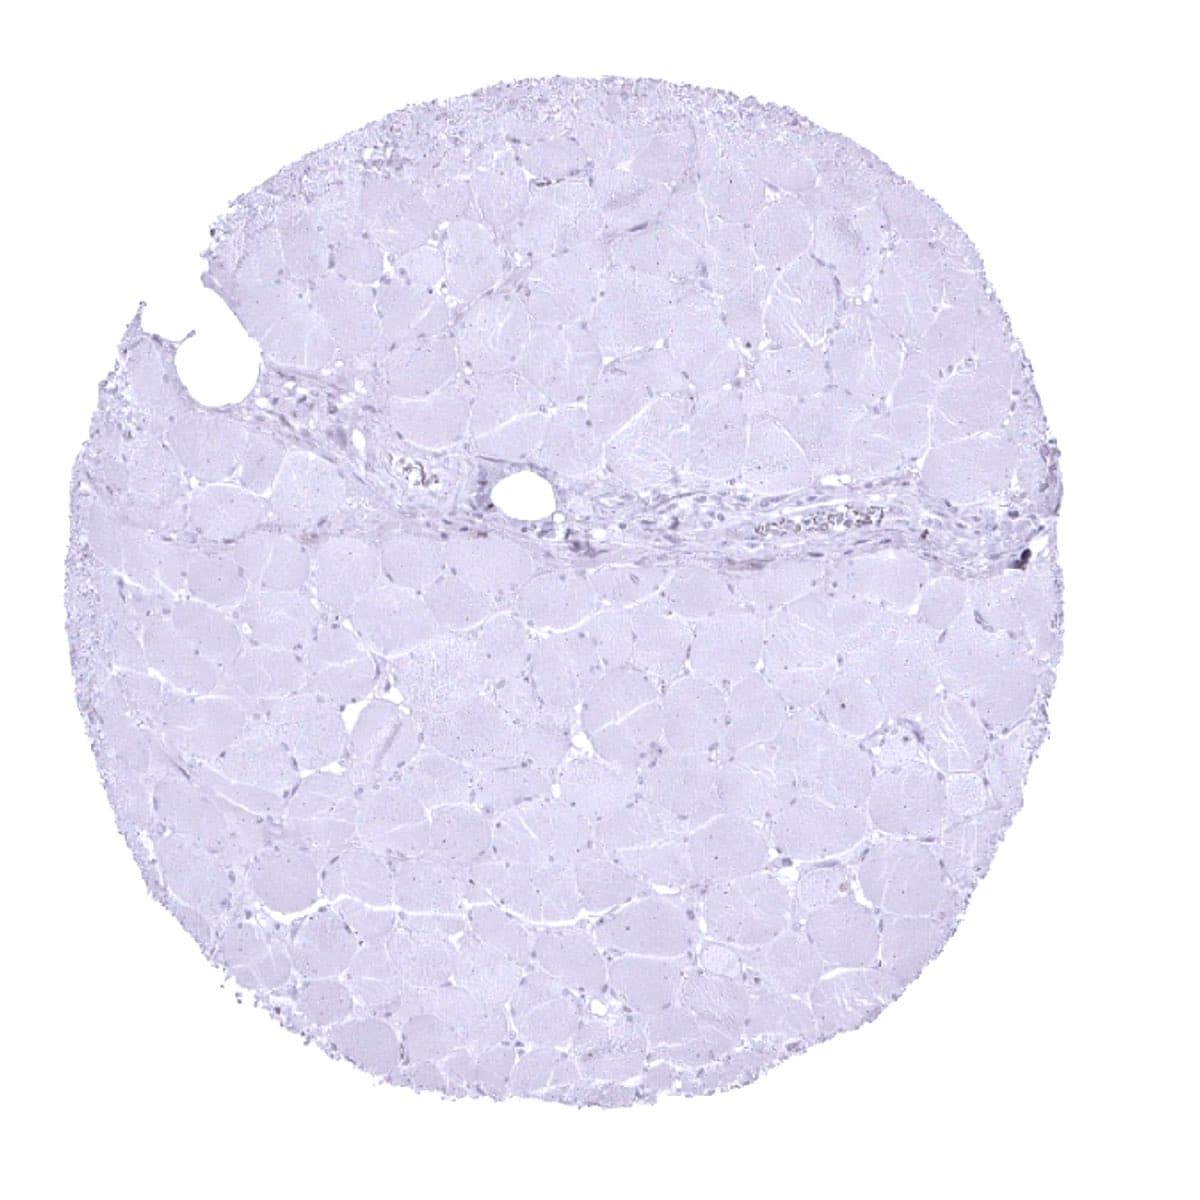
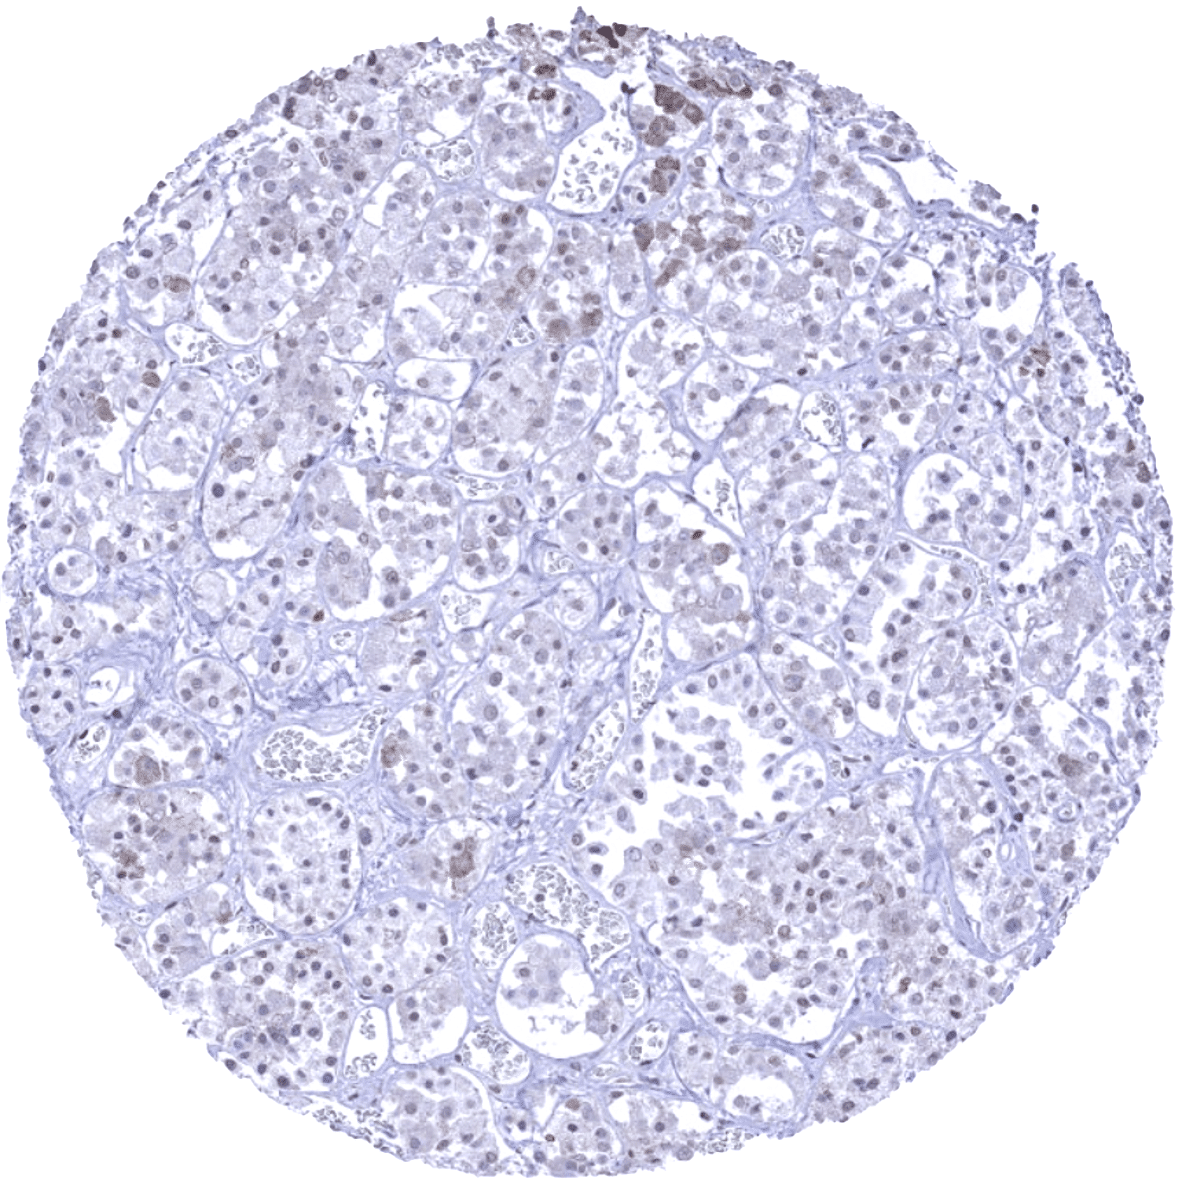
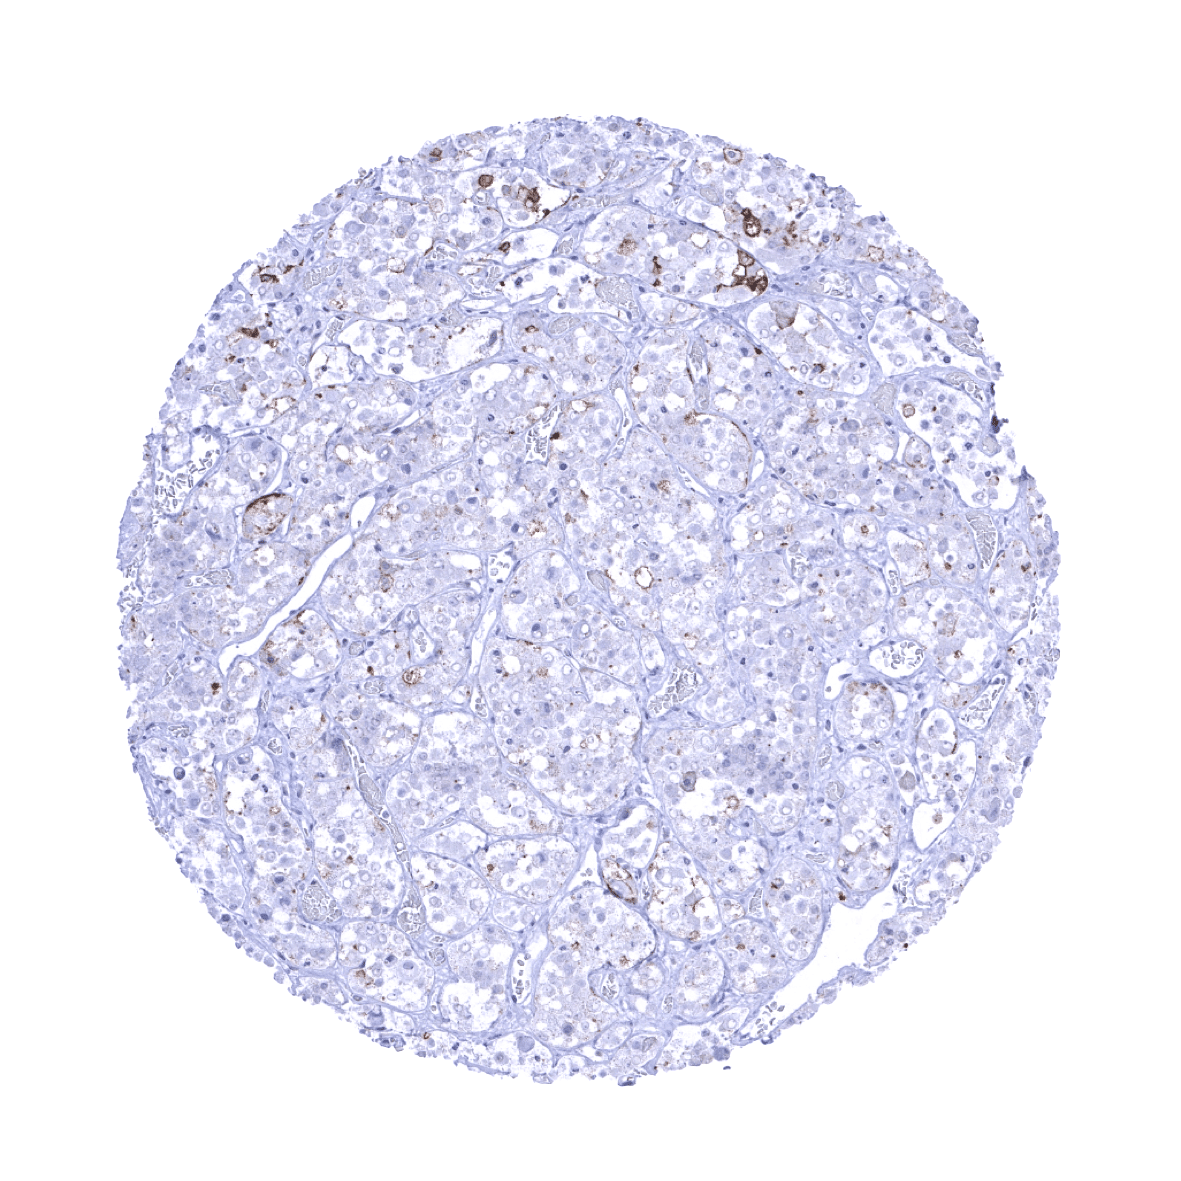
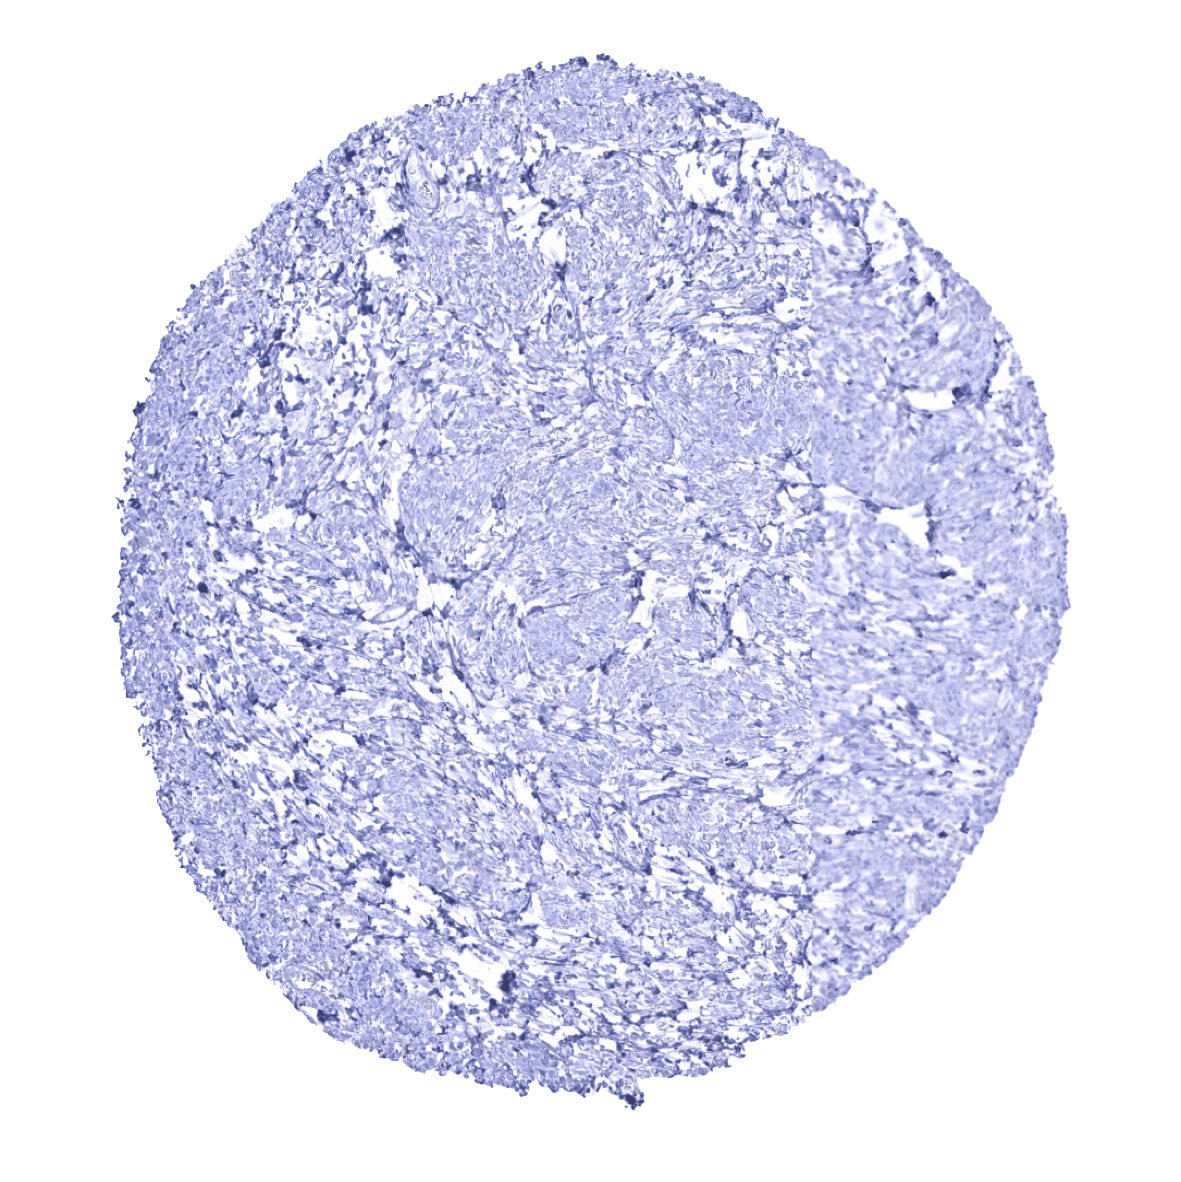
Negative control = Liver: Hepatocytes should not show any Trop-2 immunostaining.
Cellular localization = Cell Surface
Reactivity = Human
Application = Immunohistochemistry
Dilution = 1:100 – 1:200
Intended Use = Research Use Only
Relevance of Antibody
TACSTD2 is a therapeutic target protein
Biology Behind
Trophoblast cell surface antigen 2 (Trop-2, syn. Tumor-associated calcium signal transducer 2), is a membranous glycoprotein of 40 KDa encoded by the intronless TACSTD2 gene at human chromosome 1p32.The Trop-2 protein is a cell surface receptor composed of a large extracellular domain, a single transmembrane domain, and a short intracellular tail. The main function of the protein is transducing an intracellular calcium signal that is related to cellular growth. In embryonic development, Trop-2 is critical for placental formation, embryo implantation, stem cell proliferation, and organ development. Trop-2 up-regulation has been reported from several cancer types. Consistent with its role in embryogenesis, Trop-2 expression is regulated by several oncogenic transcription factors such as CREB1, NF–κB, HOXA10, HNF4A, TP63, TP53, ERG, HNF1A/TCF-1, and FOXP3. Trop-2 knock-out cells show a disturbed proliferation while overexpression of Trop-2 accelerates the cancer cell cycle and drives cancer growth. Trop-2 is the target of sacituzumab govitecan, an antibody-drug conjugate which has been approved for treatment of triple negative breast cancer.
Staining Pattern in Normal Tissues
Trop2 staining pattern in Normal Tissues with antibody MSVA-733R (images are shown in our “Normal Tissue Gallery”)
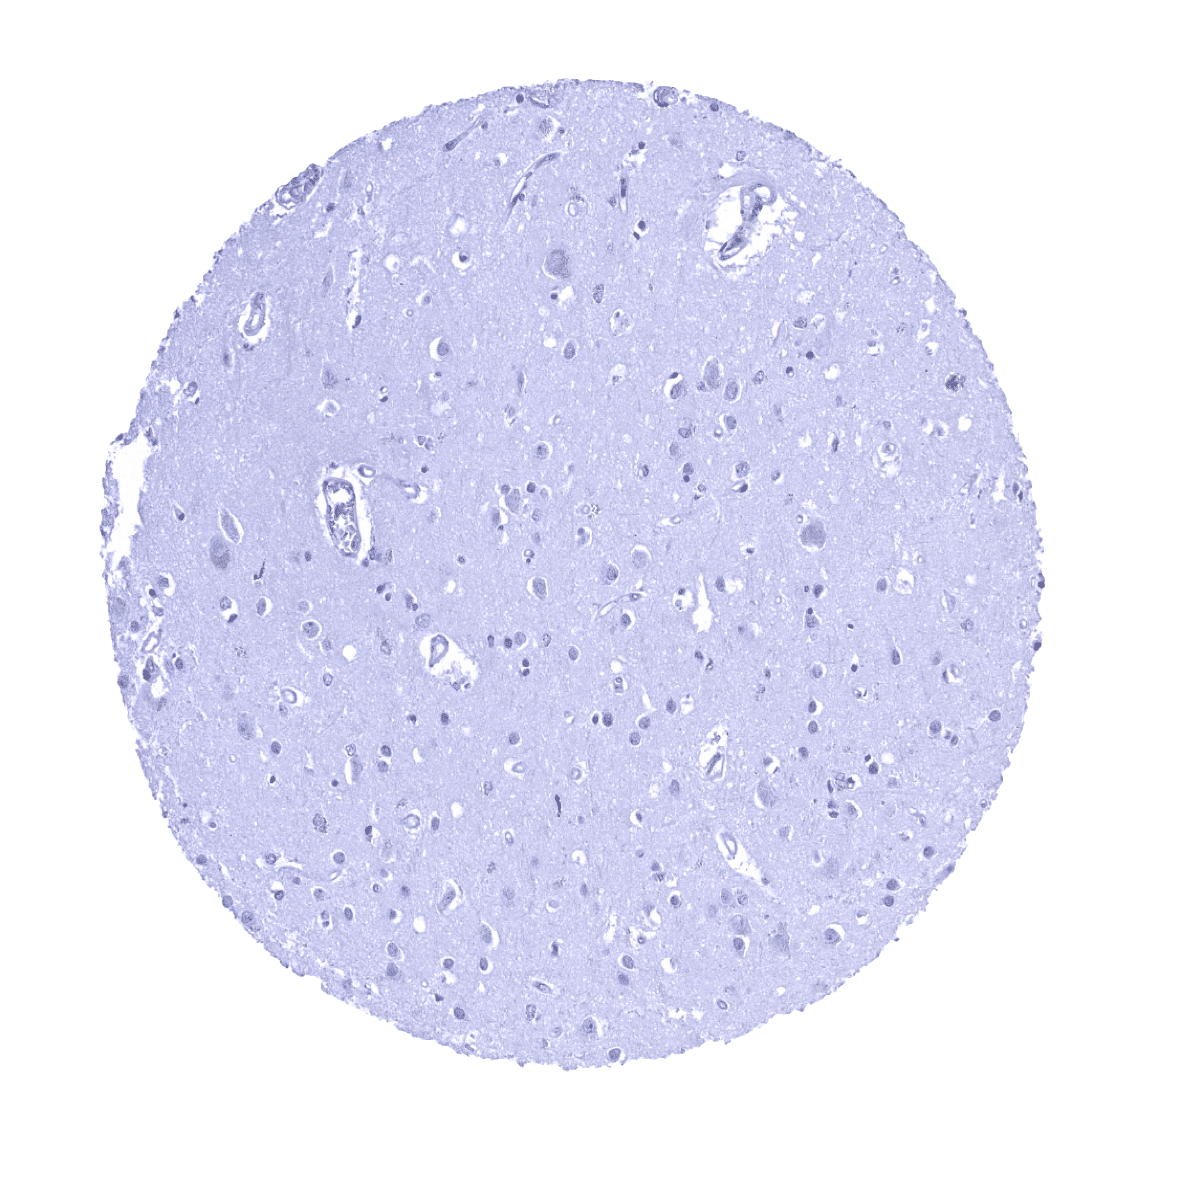
| Brain | Cerebrum | Negative. |
| Cerebellum | Negative. | |
| Endocrine Tissues | Thyroid | Moderate to strong Trop-2 staining of apical membranes in a variable number of follicles. |
| Parathyroid | Negative. | |
| Adrenal gland | Negative. | |
| Pituitary gland | Moderate Trop-2 staining of a small fraction of epithelial cells of the adenohypophysis. | |
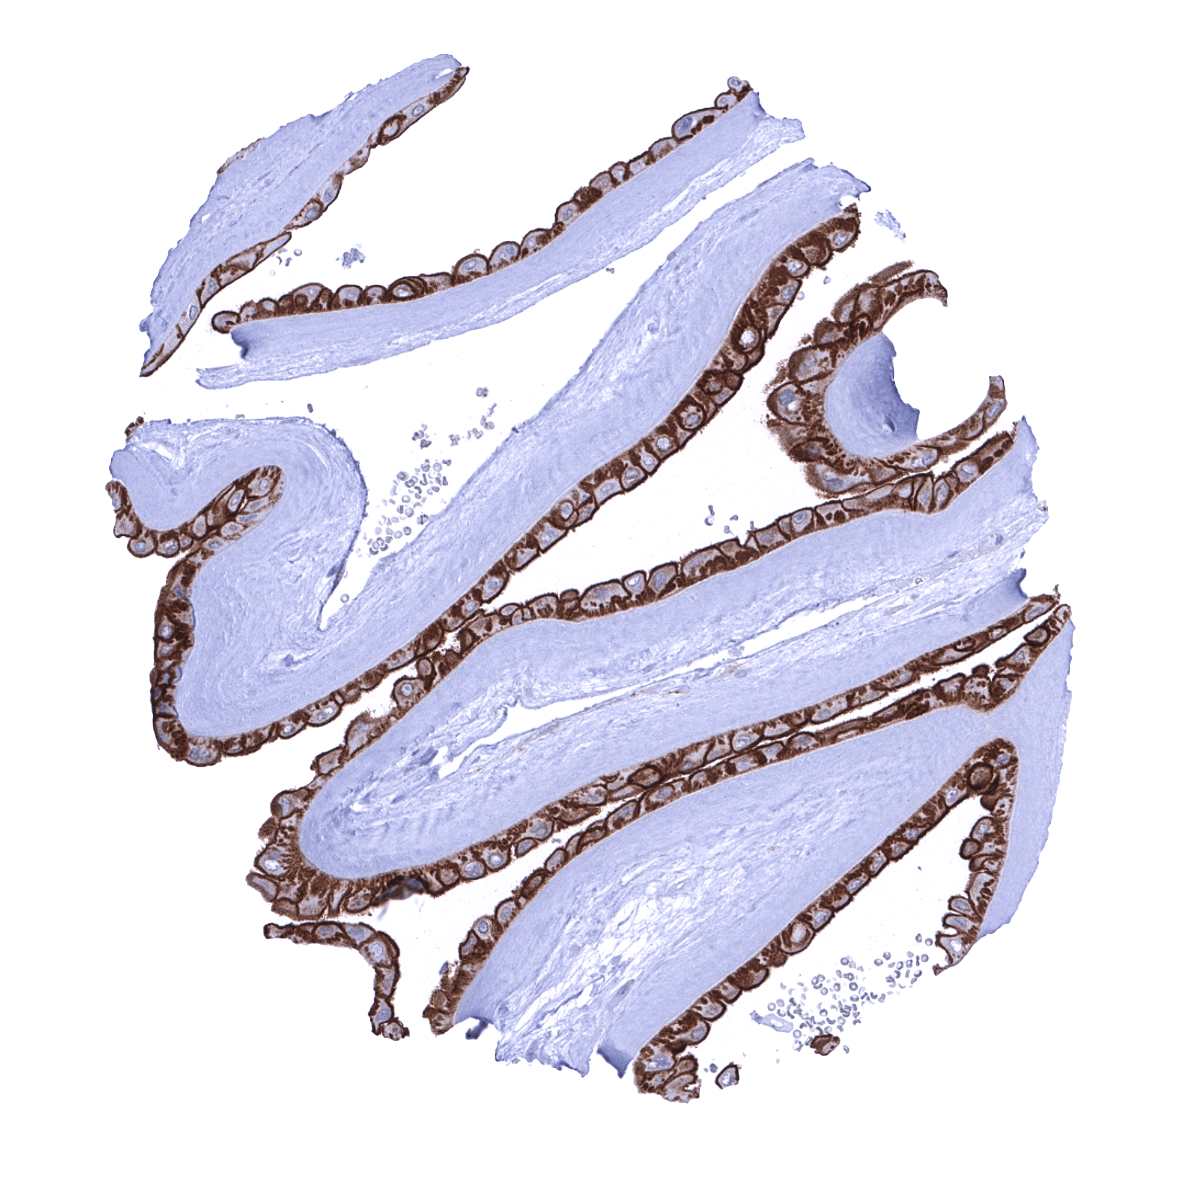
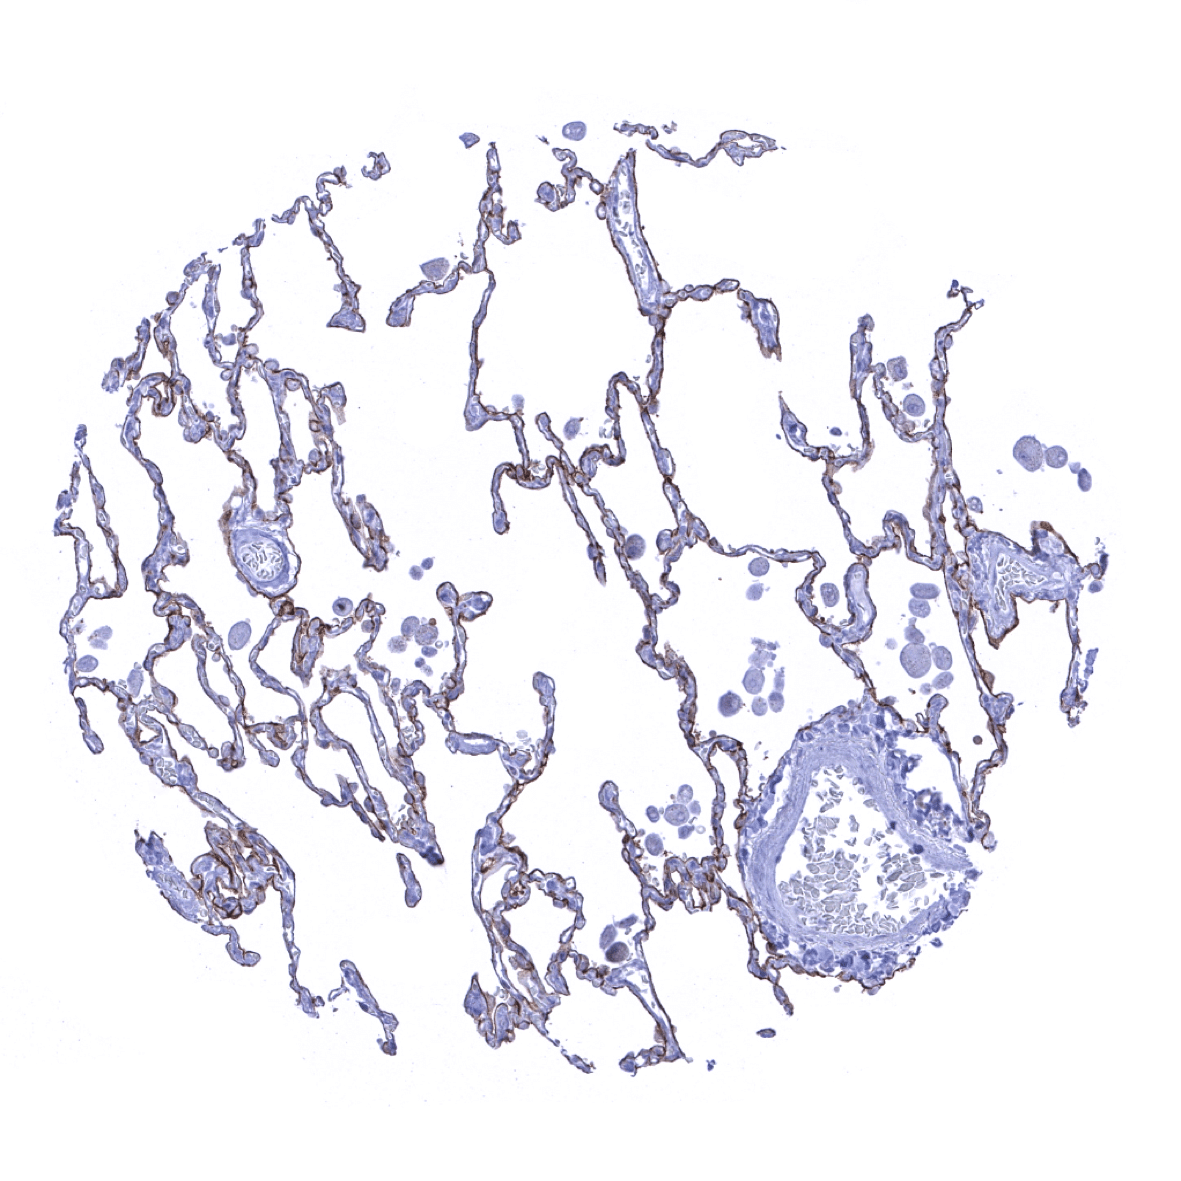
| Respiratory system | Respiratory epithelium | Strong Trop-2 staining of all cells of the respiratory epithelium. Moderate Trop-2 staining of bronchial glands. |
| Lung | Moderate Trop-2 staining of all pneumocytes. | |
| Gastrointestinal Tract | Salivary glands | Strong Trop-2 staining of all epithelial cells. |
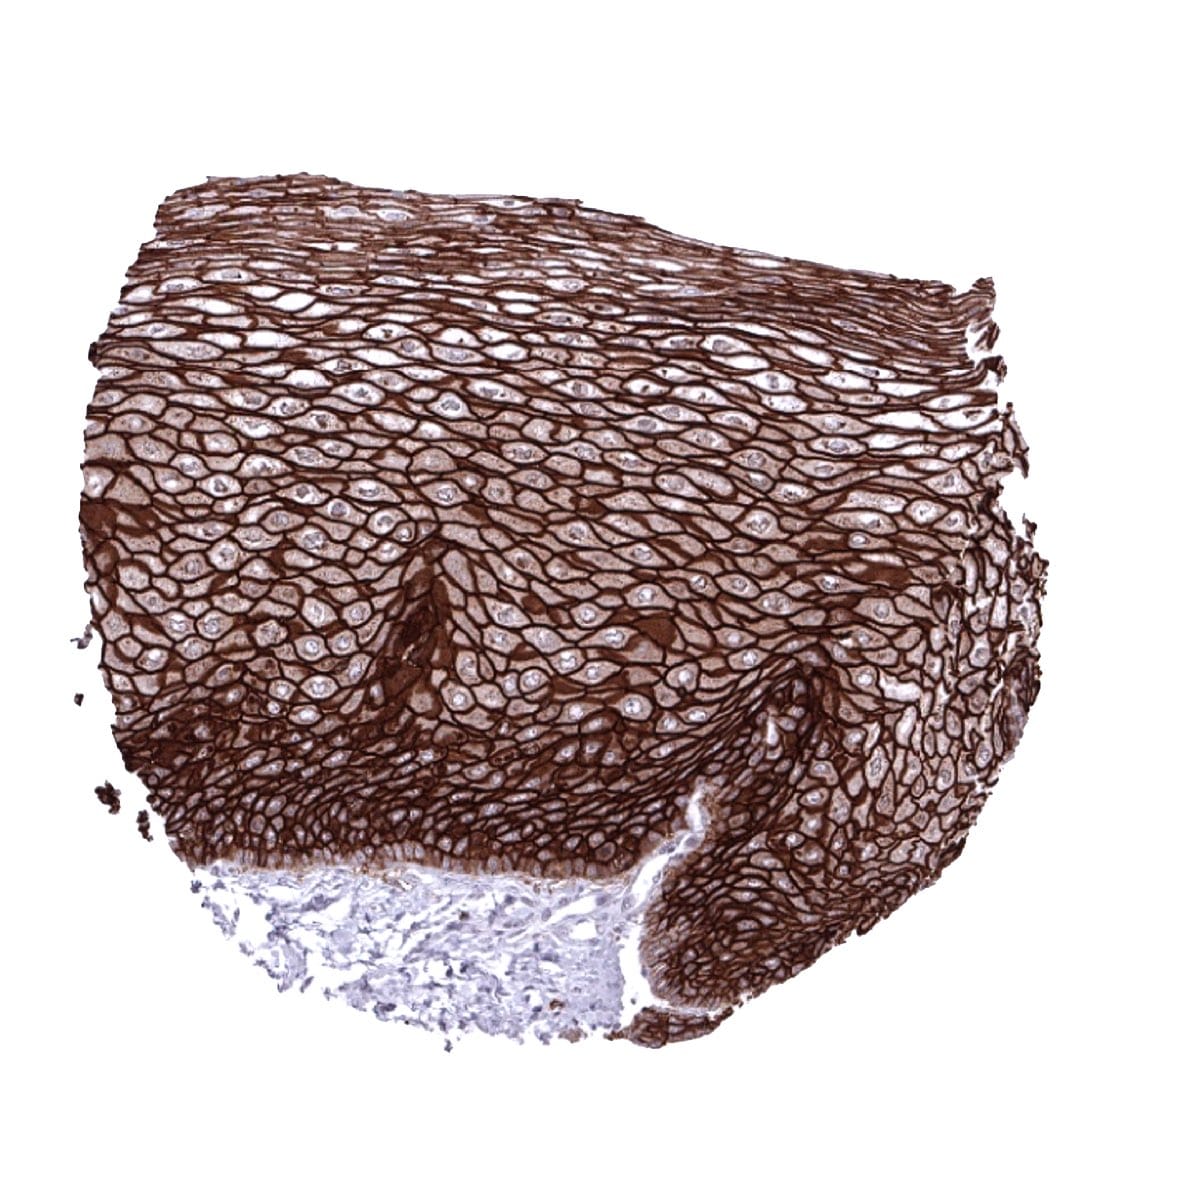
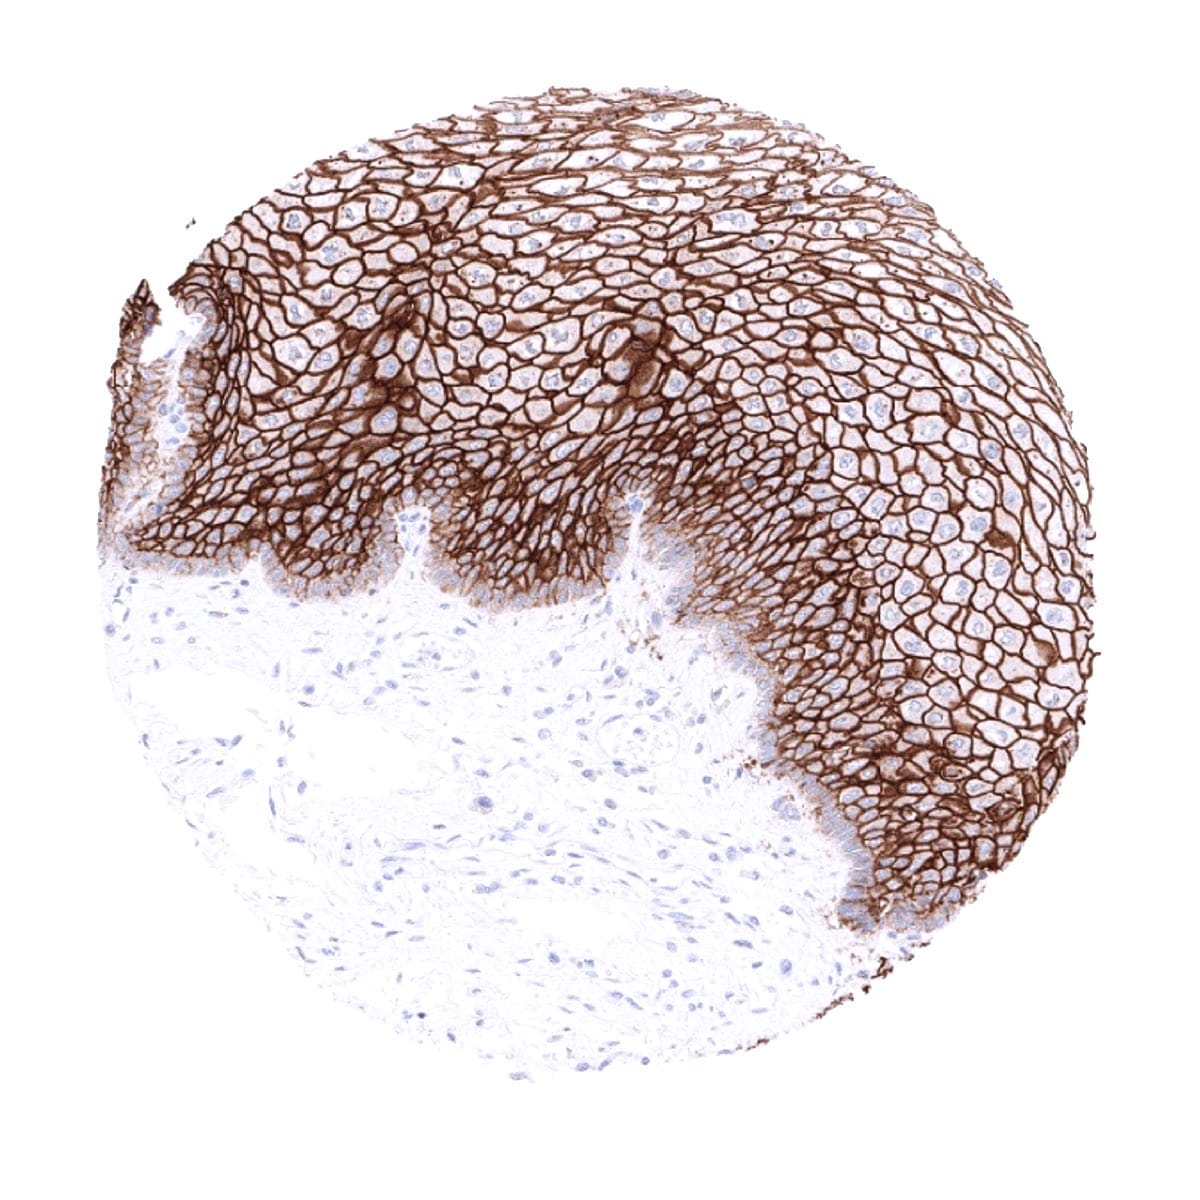
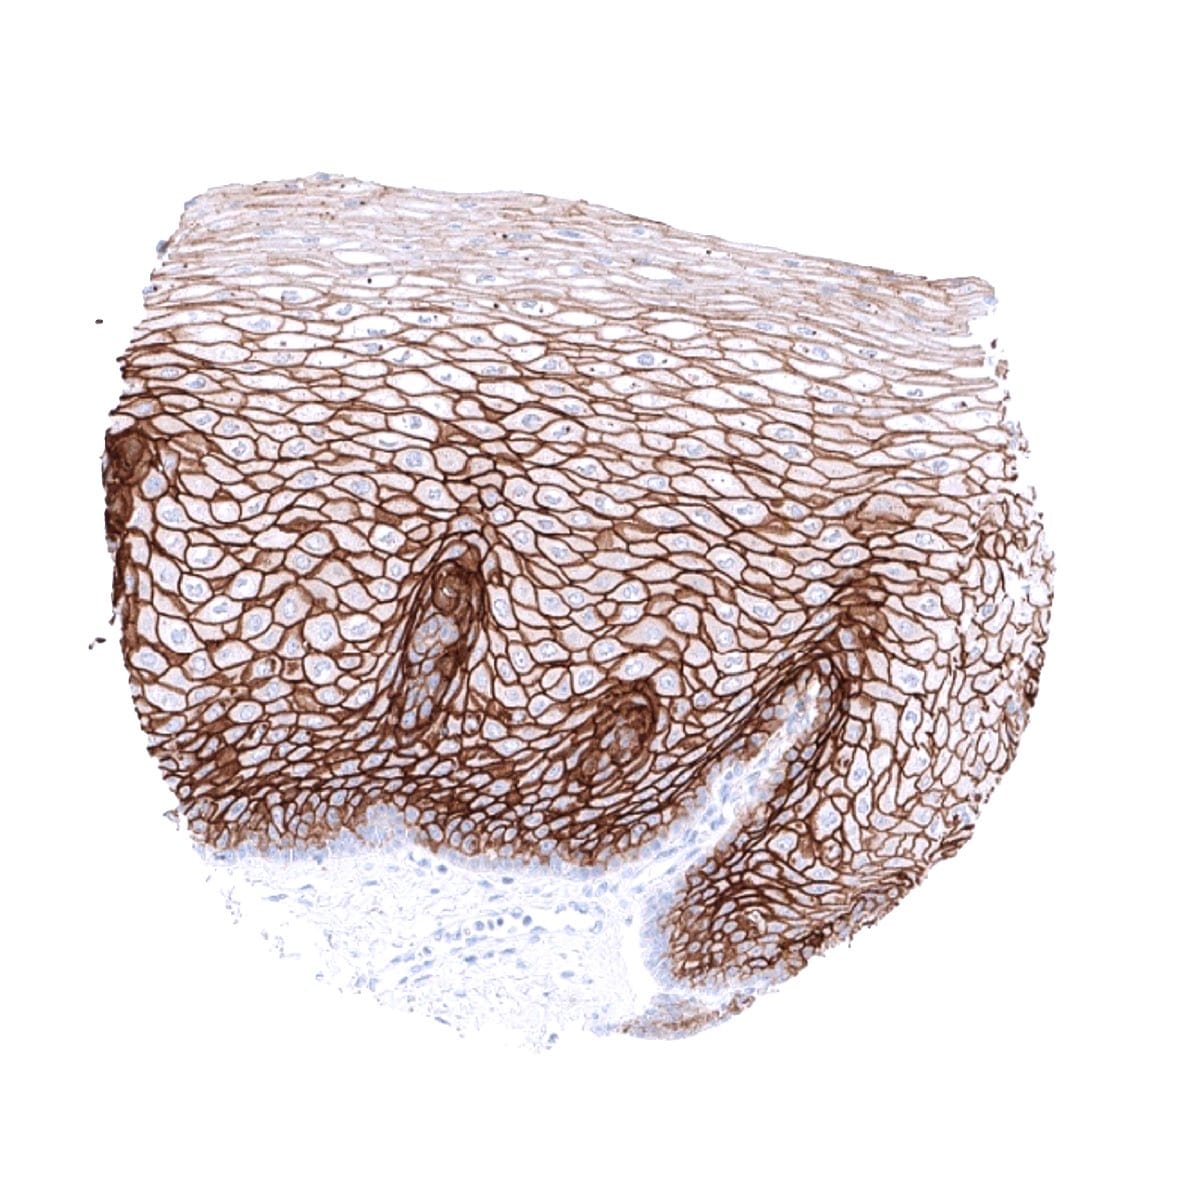
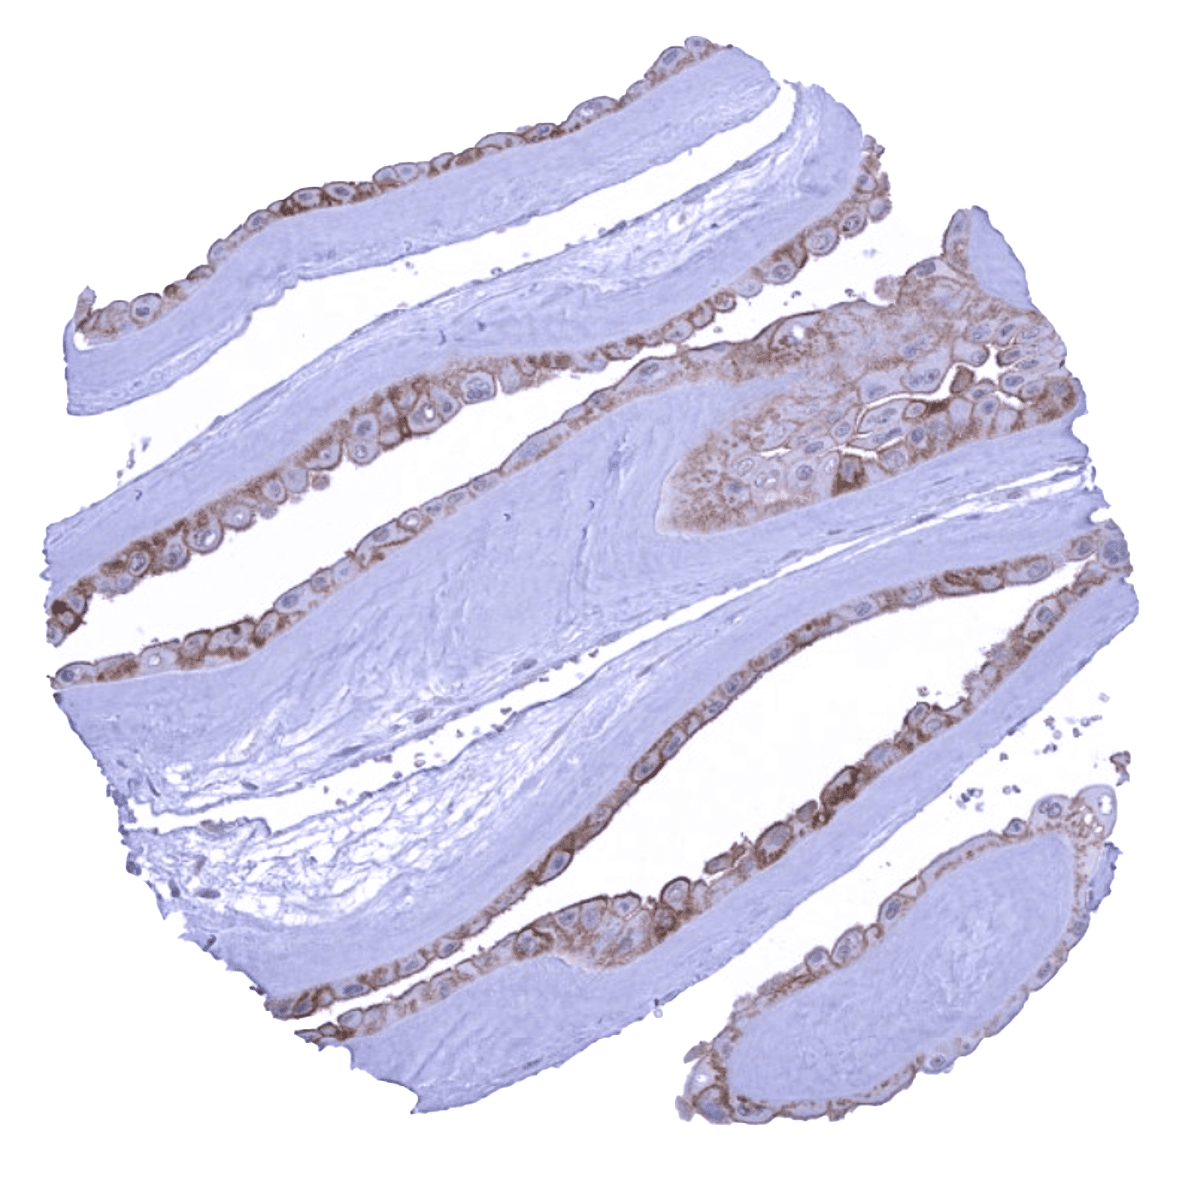
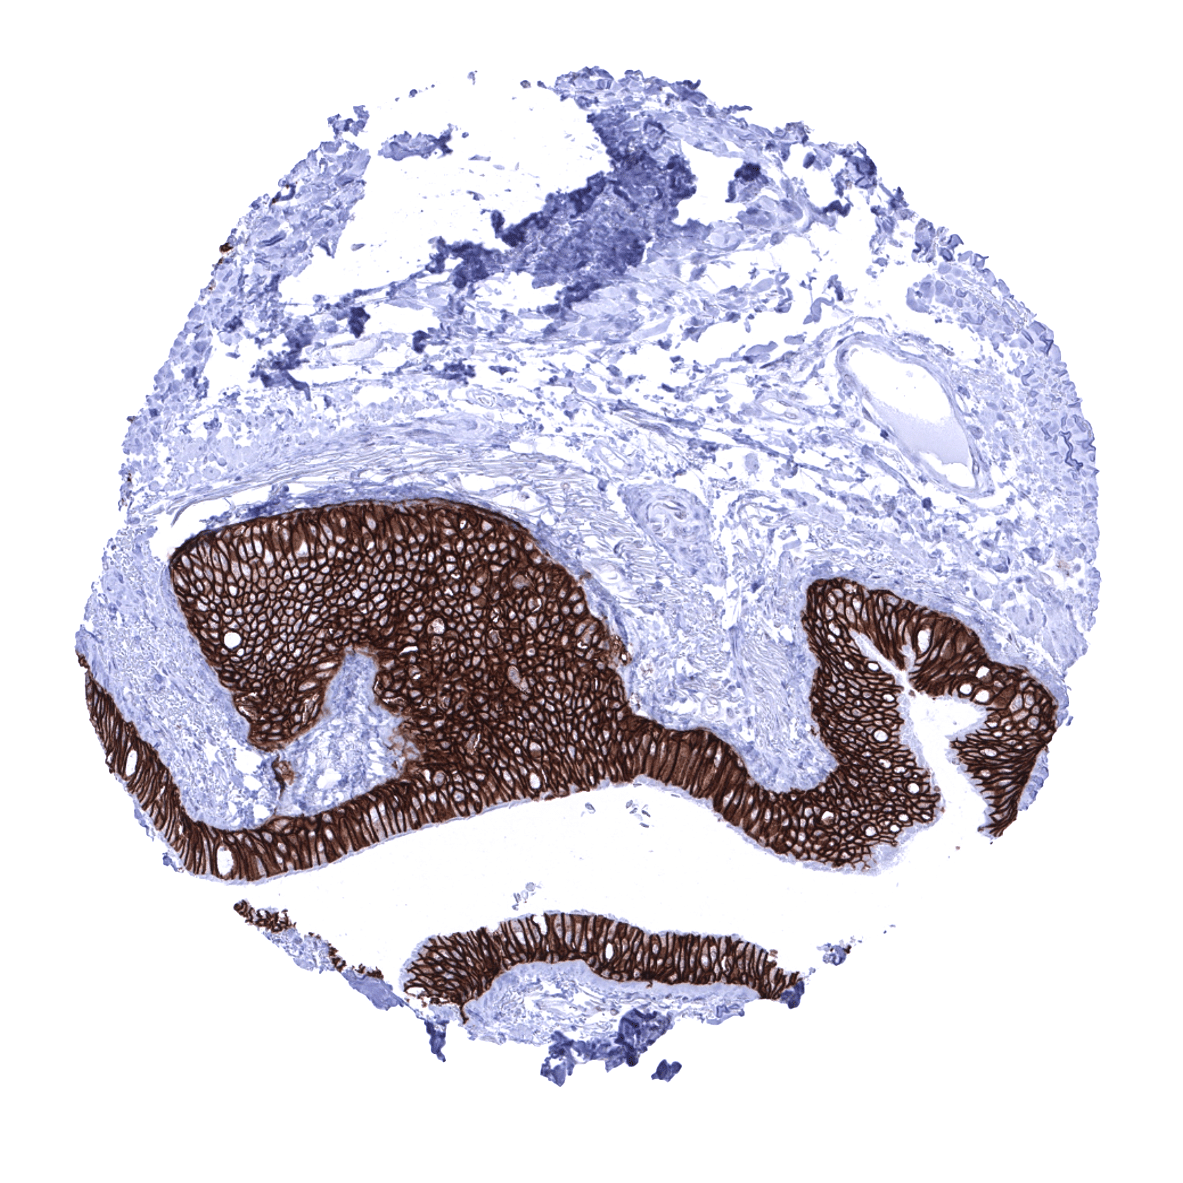
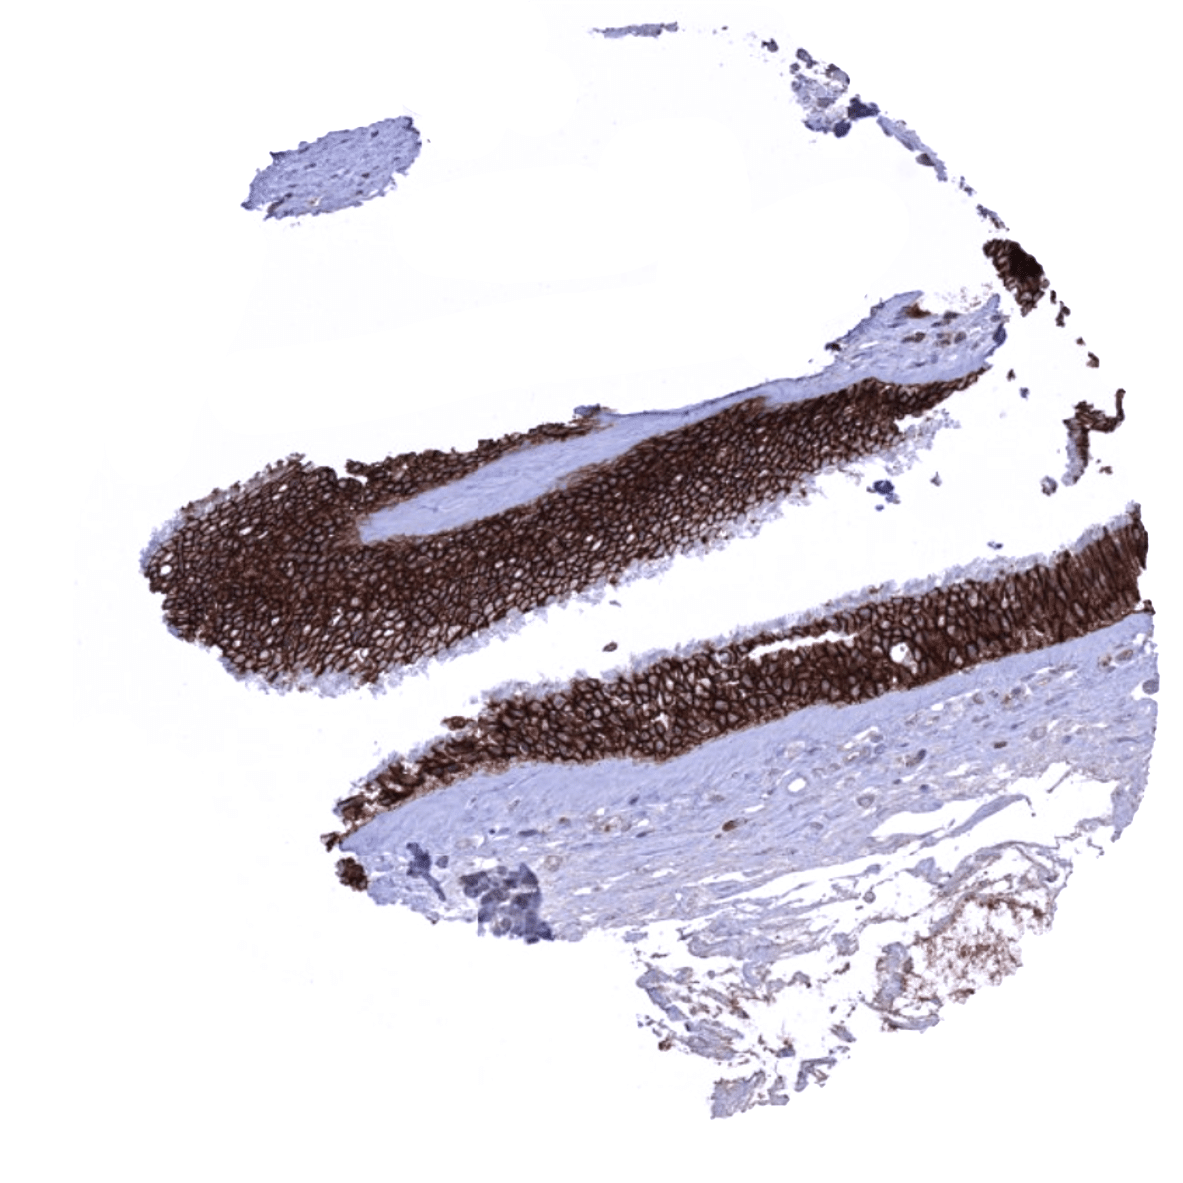
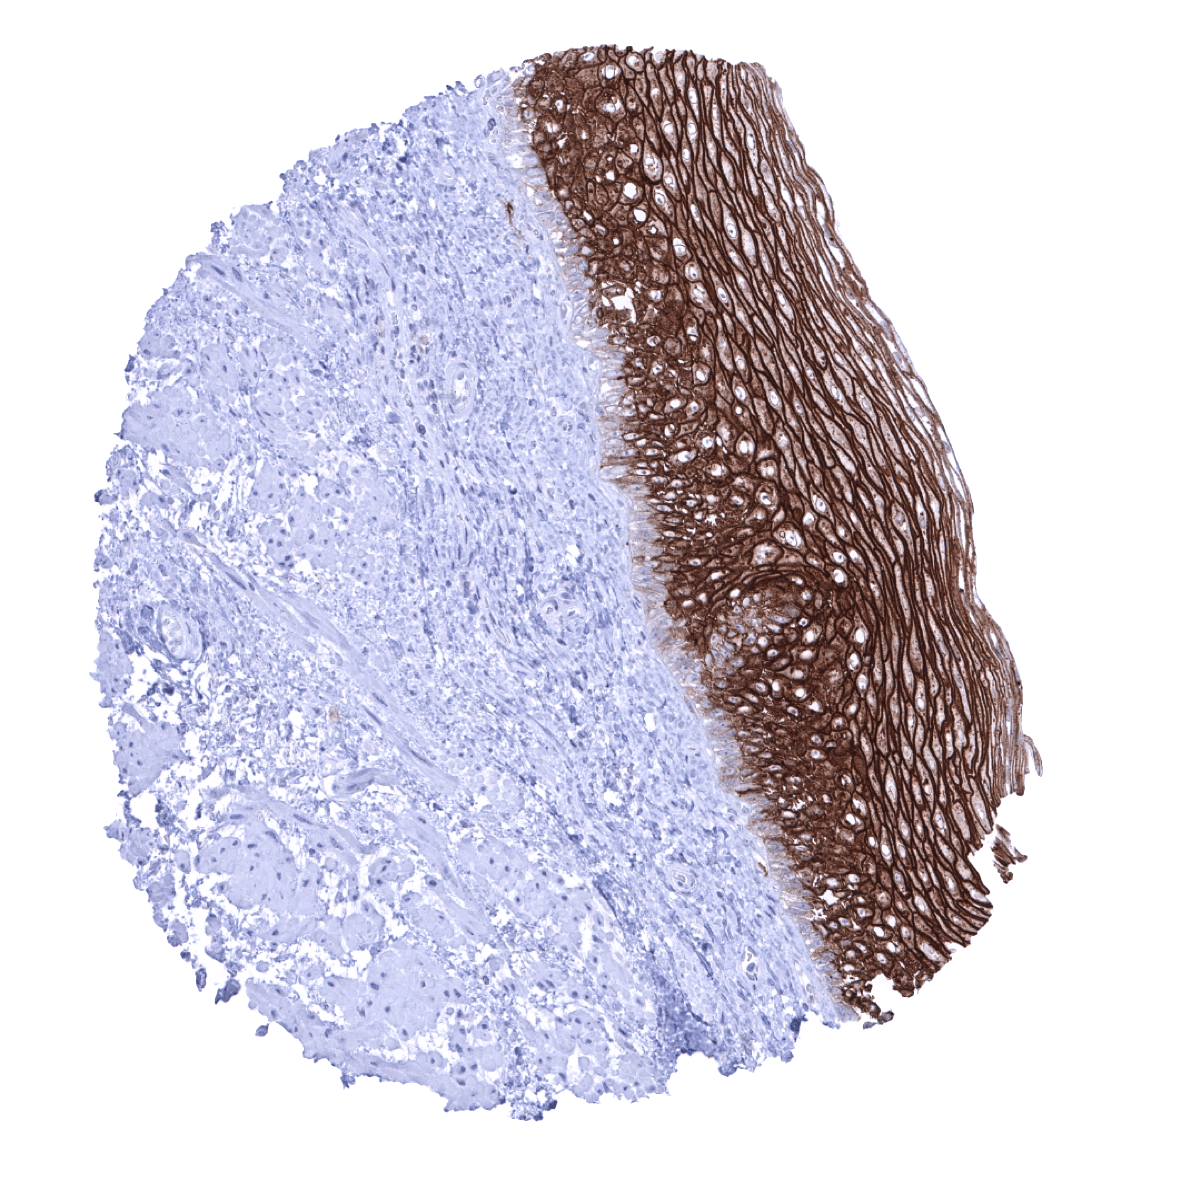
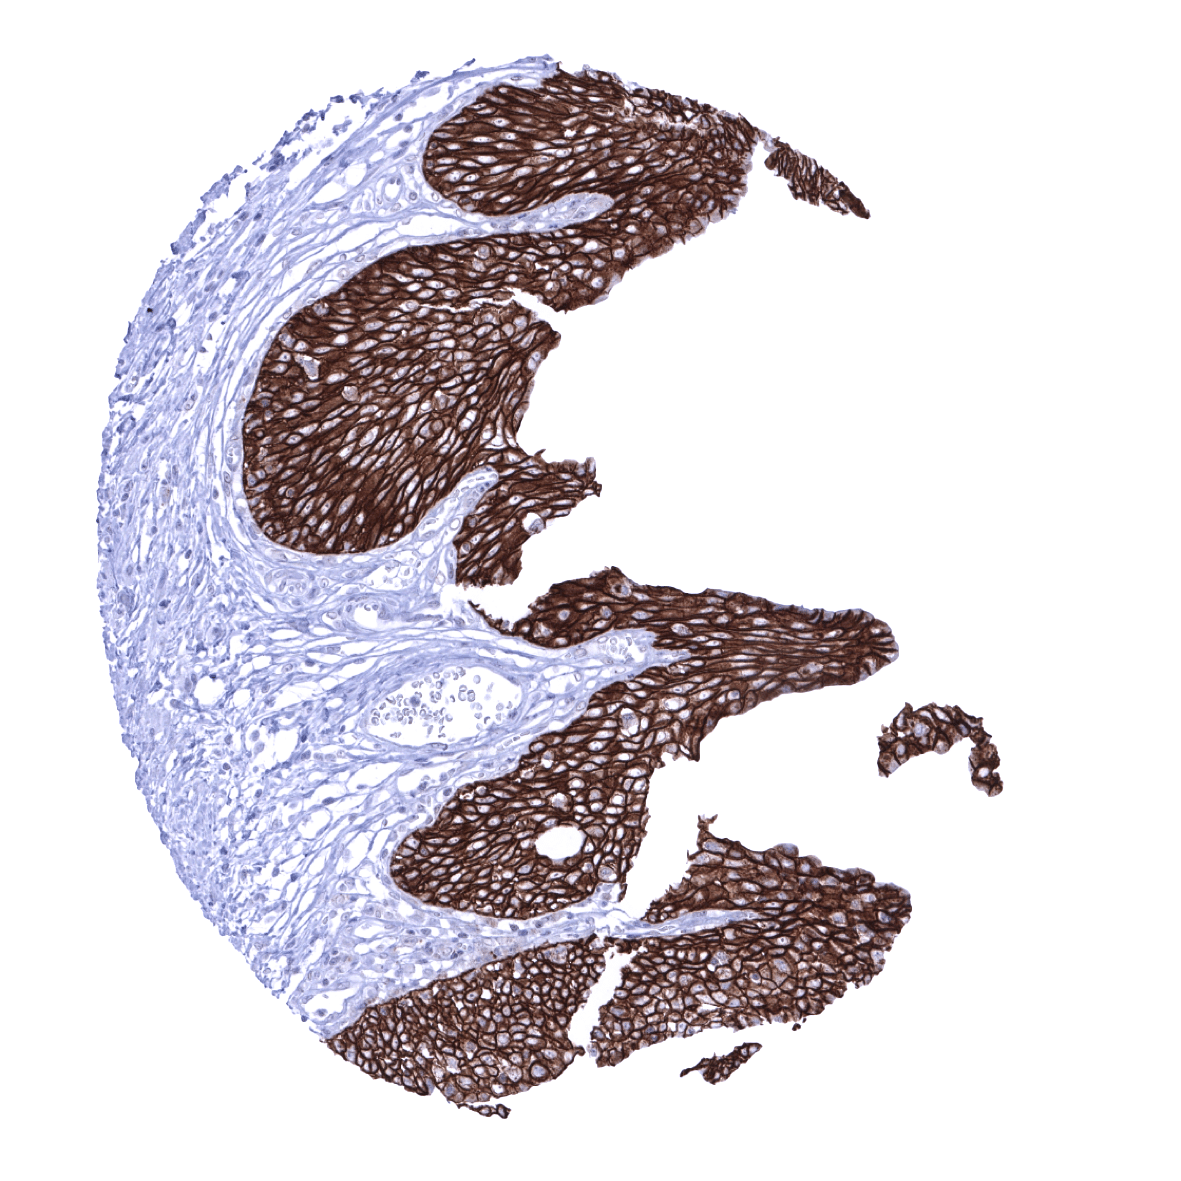
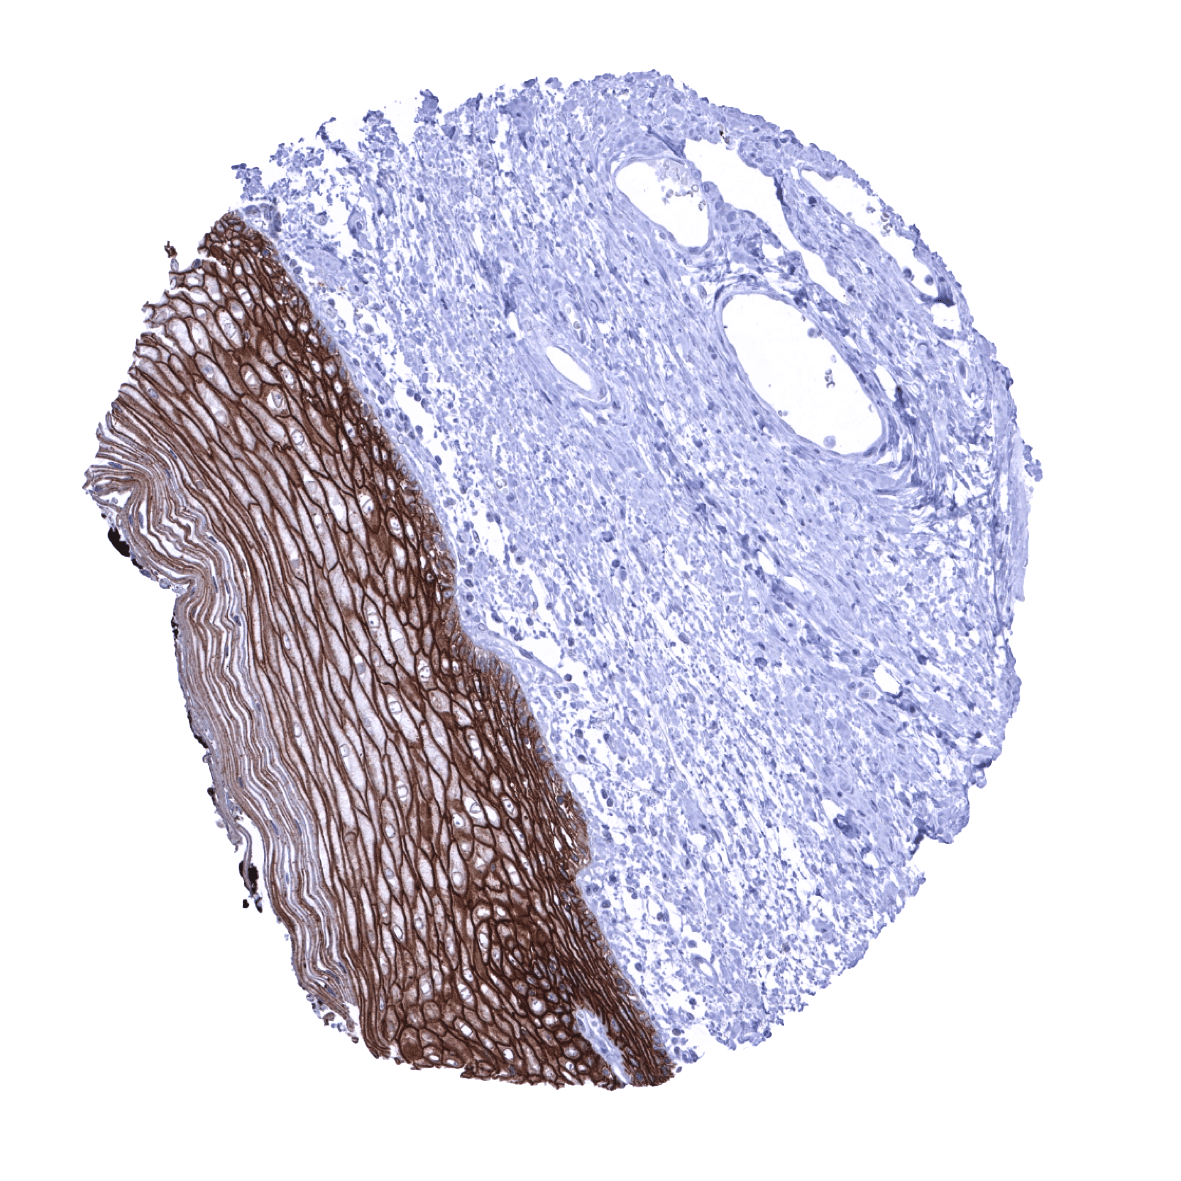
| Esophagus | Strong Trop-2 staining of all squamous epithelial cells, with the exception of basal cells which are negative or only weakly positive. | |
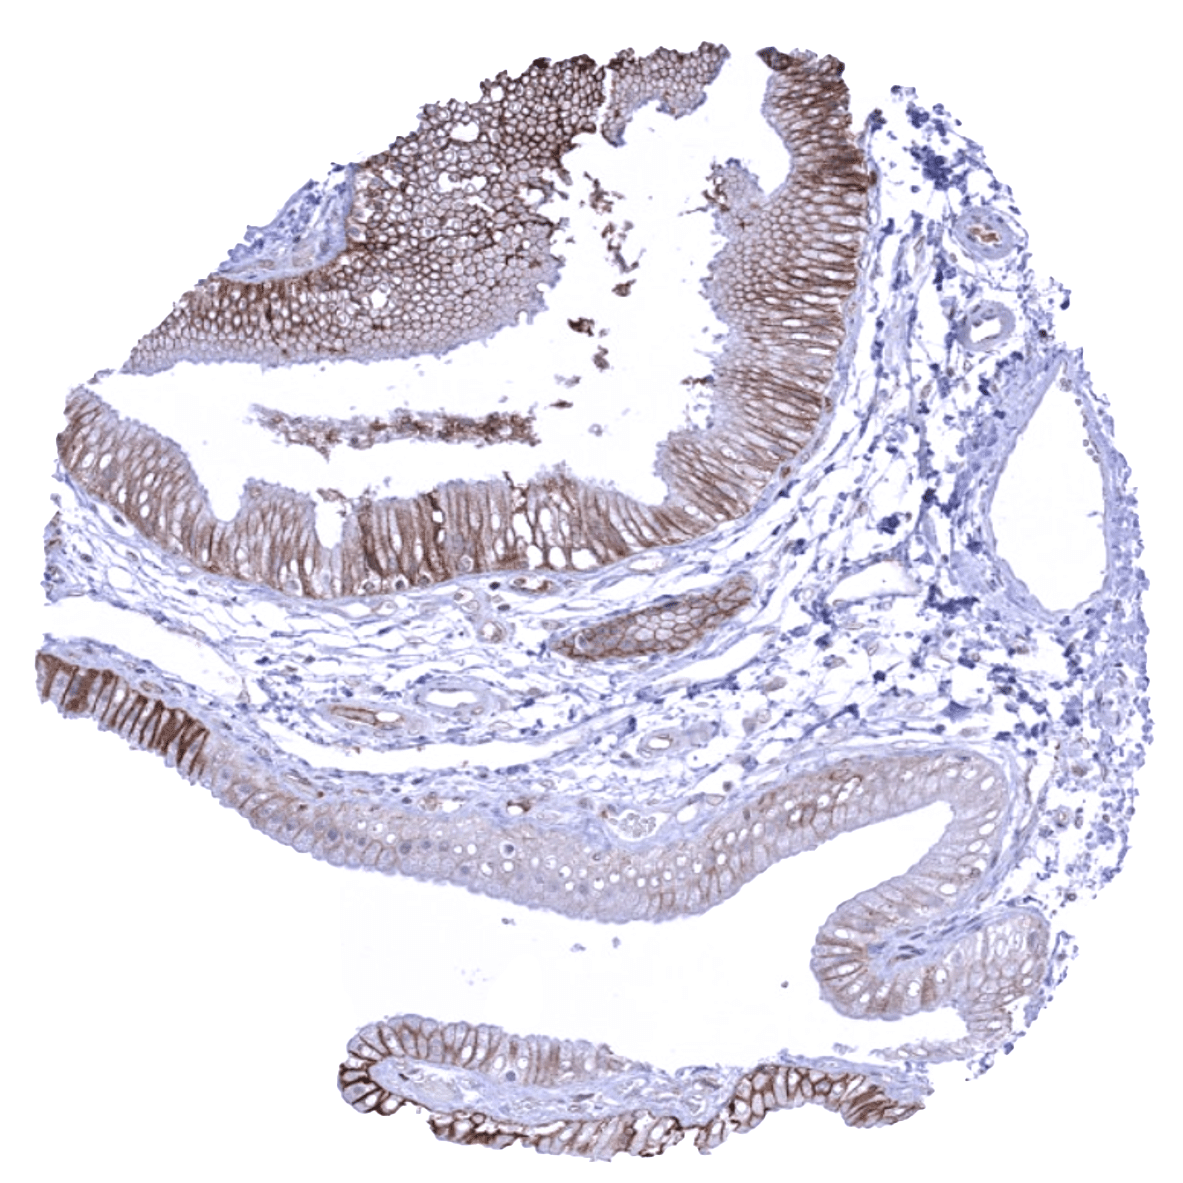
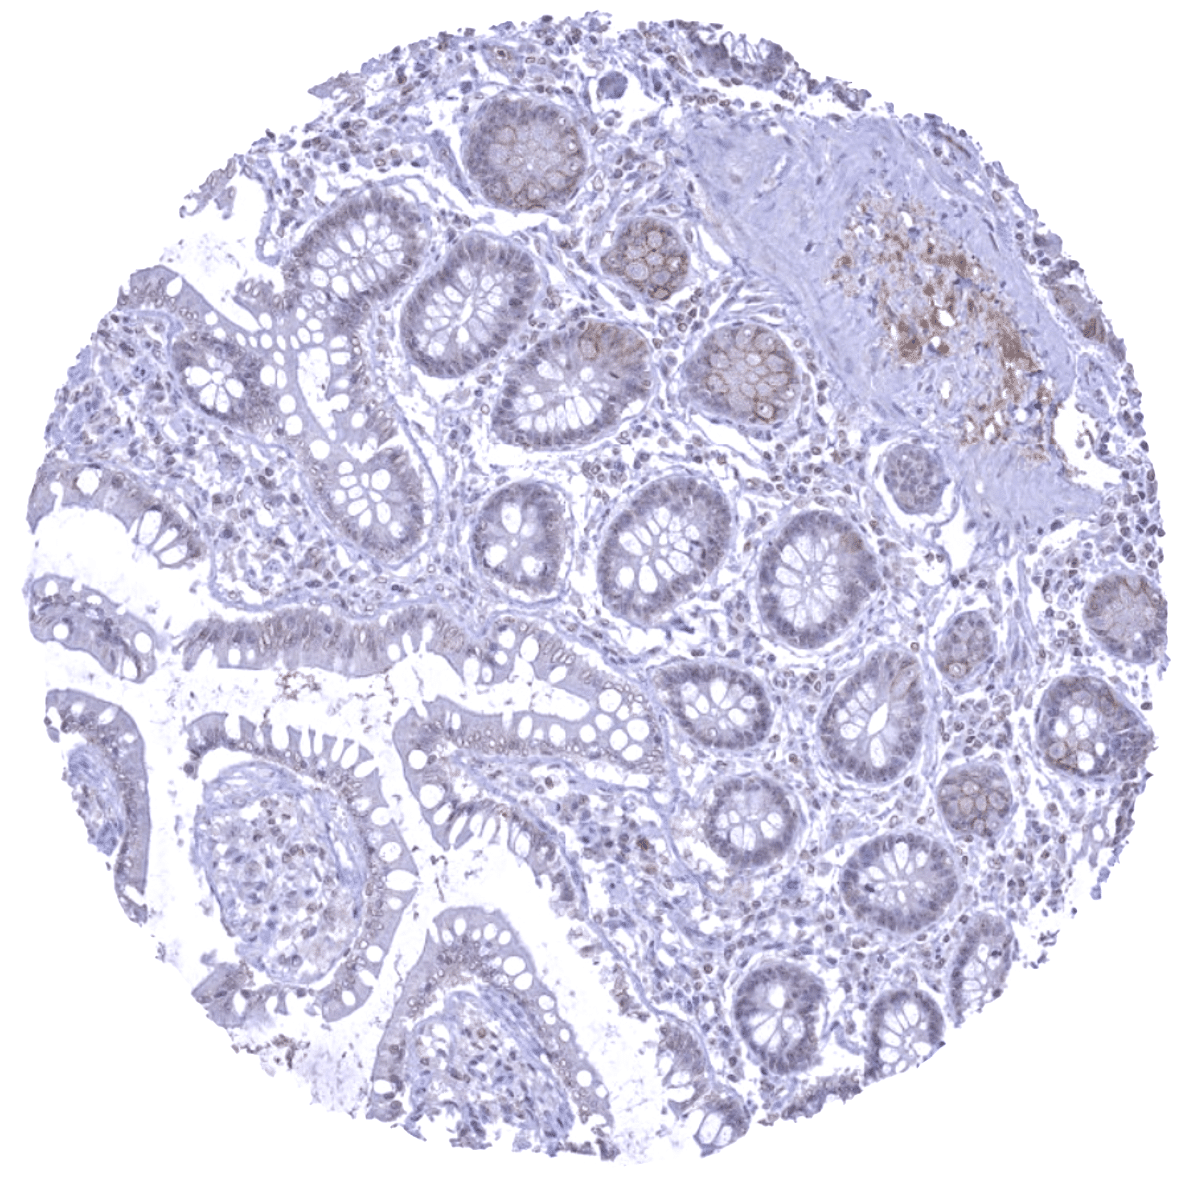
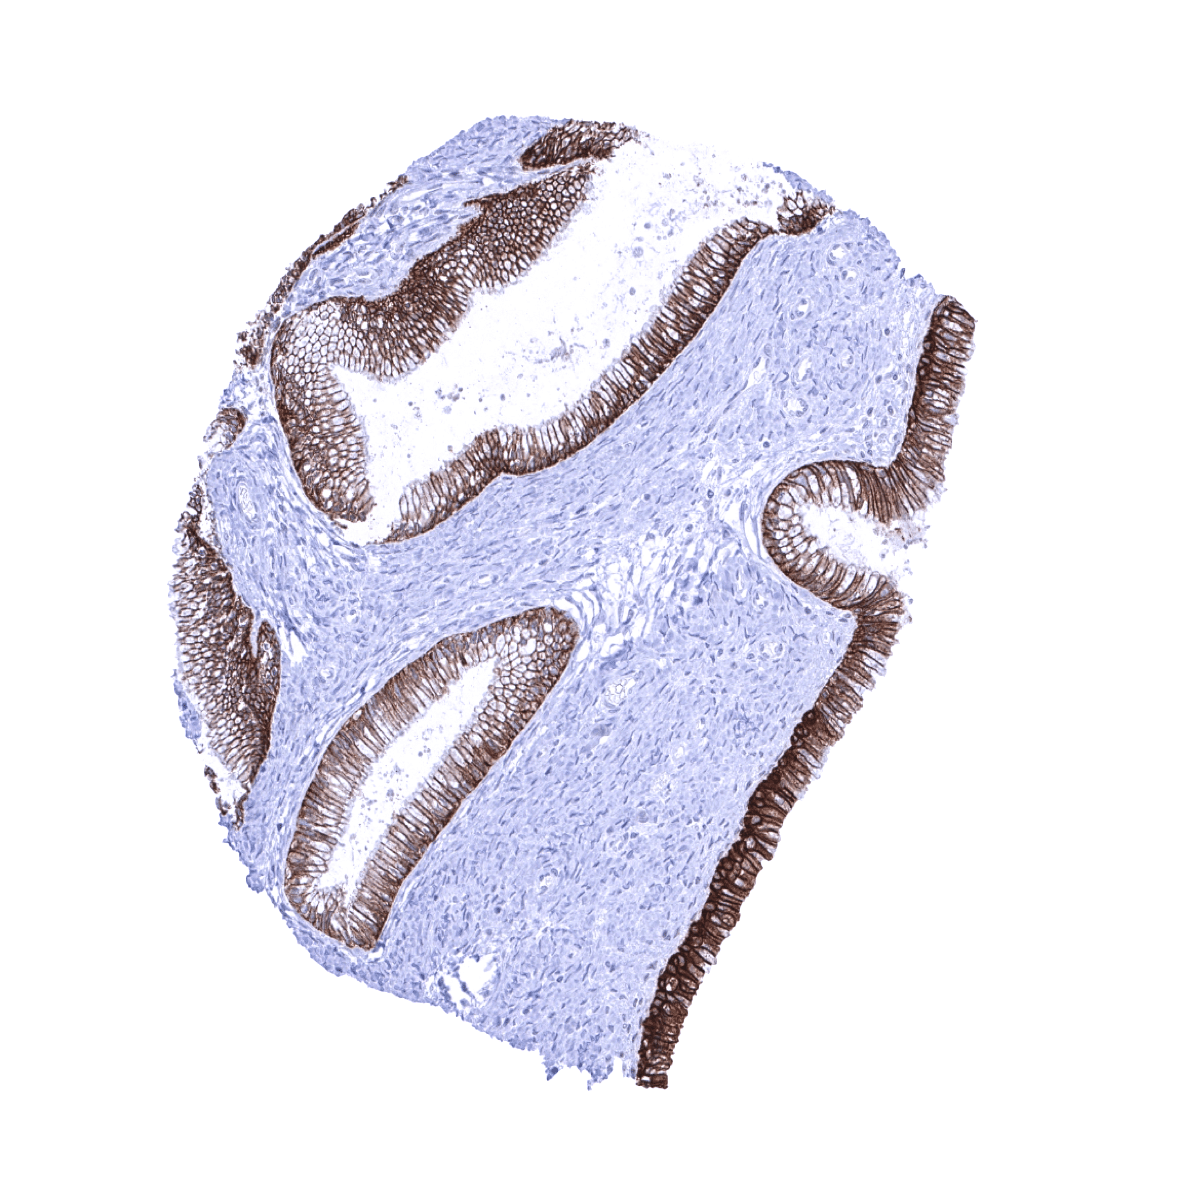
| Stomach | Moderate Trop-2 staining of superficial epithelial cell layers. | |
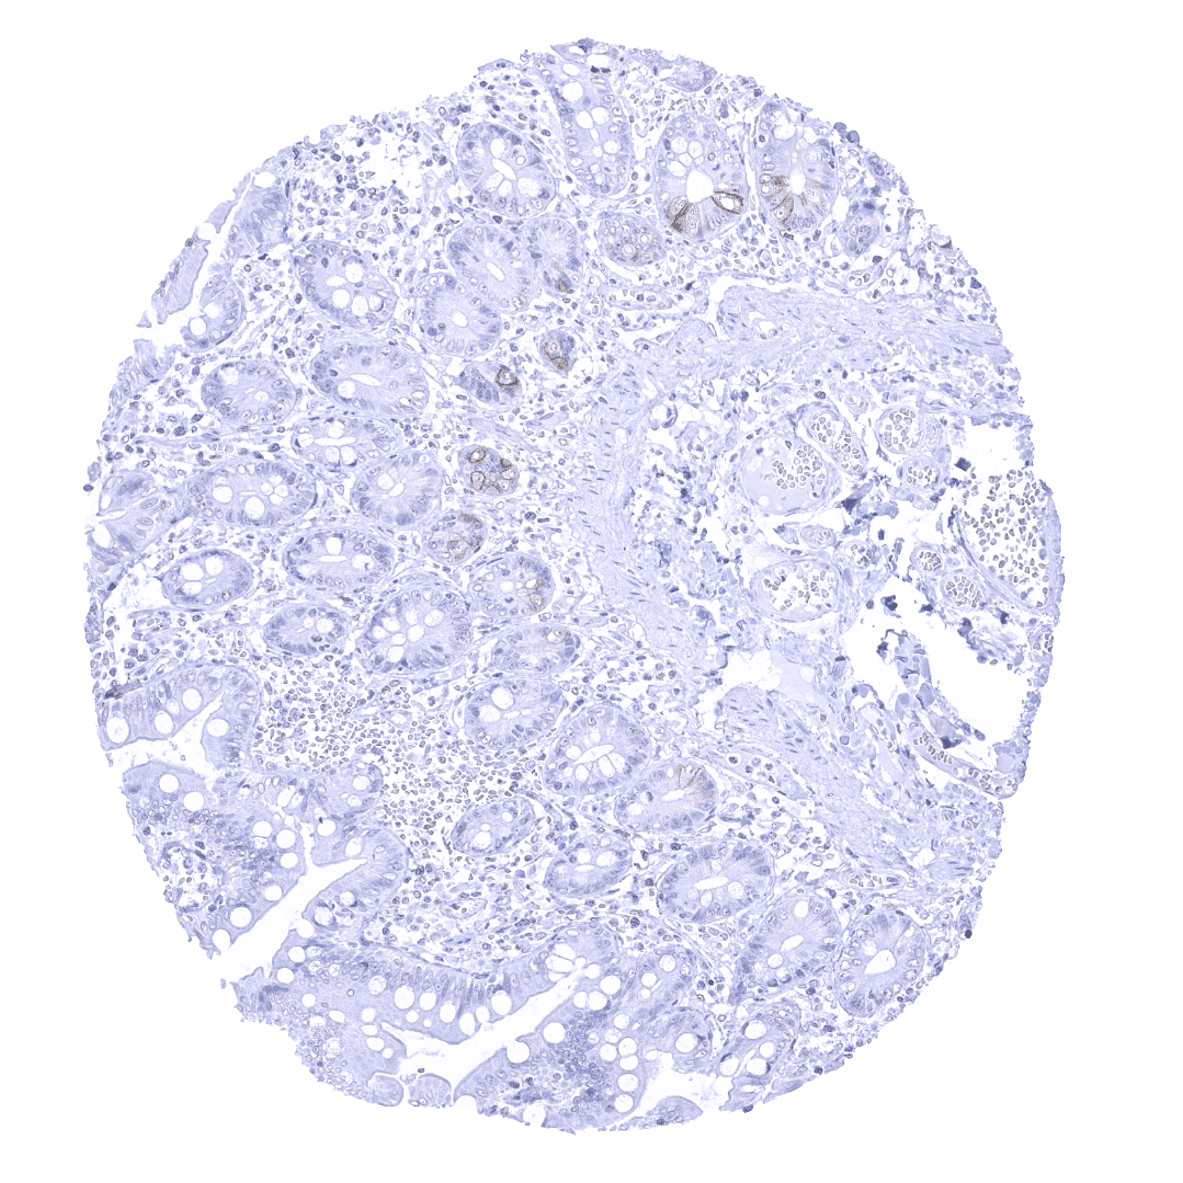
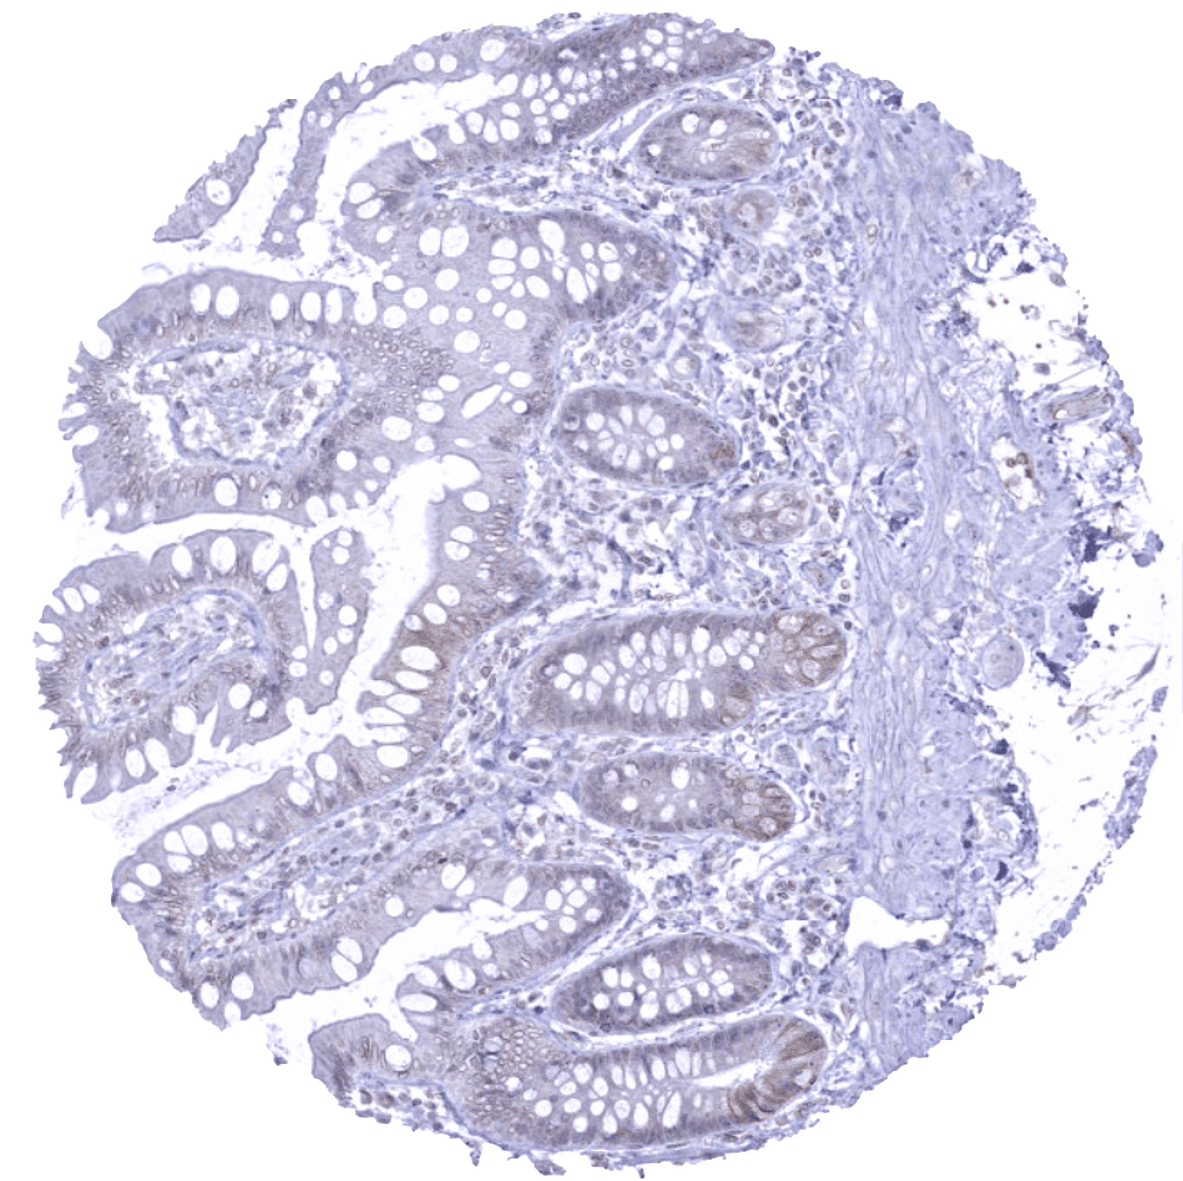
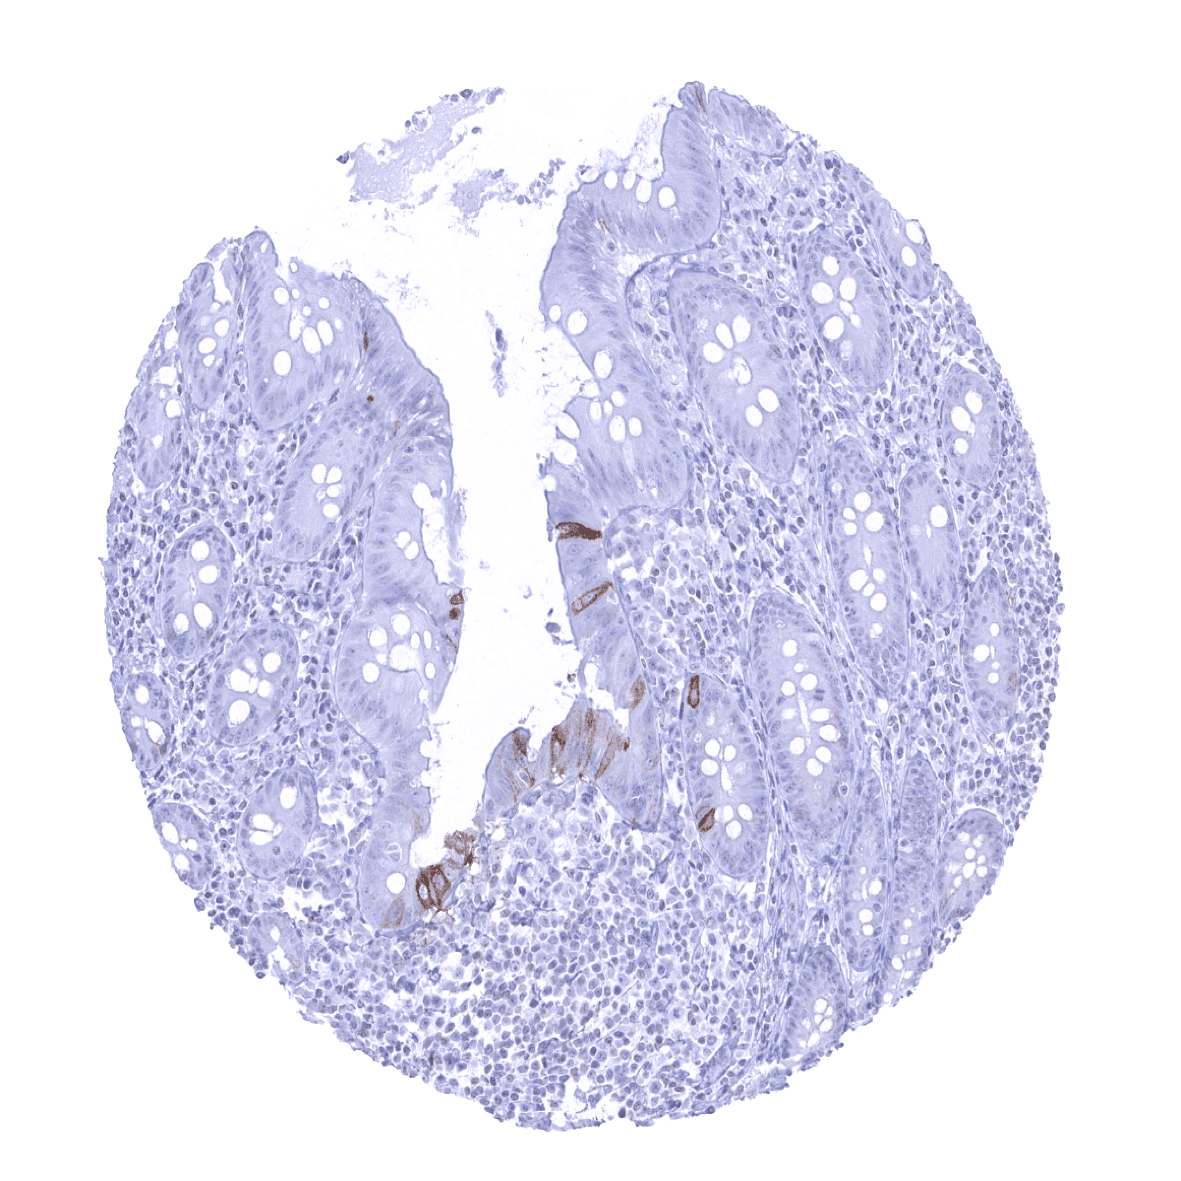
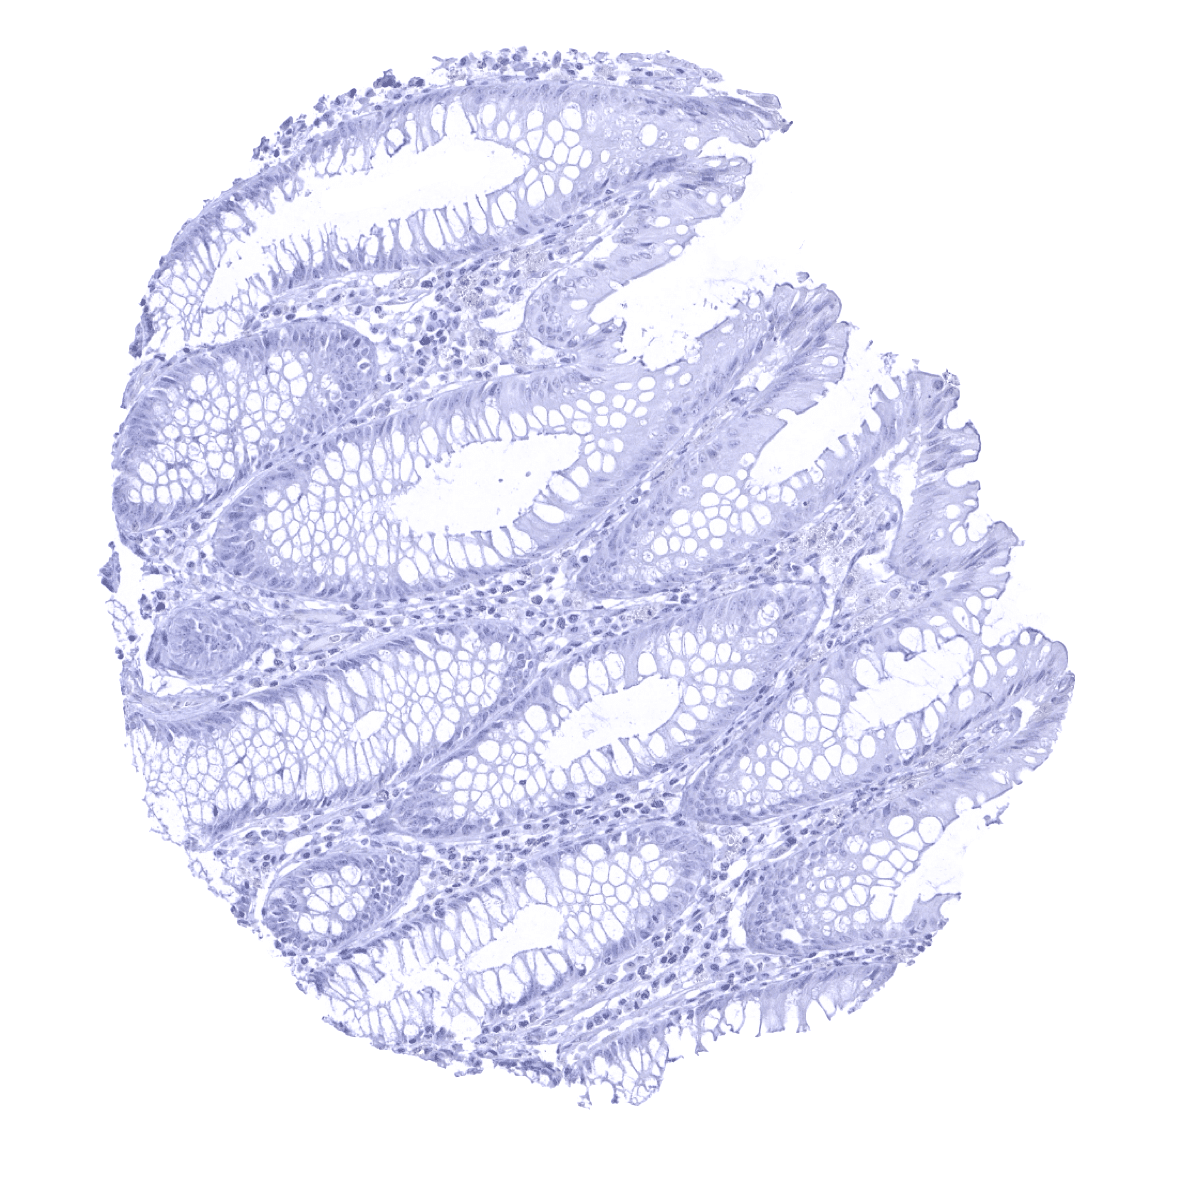
| Duodenum | Few scattered Trop-2 positive epithelial cells. | |
| Small intestine | Few scattered Trop-2 positive epithelial cells. | |
| Appendix | Few scattered Trop-2 positive epithelial cells. | |
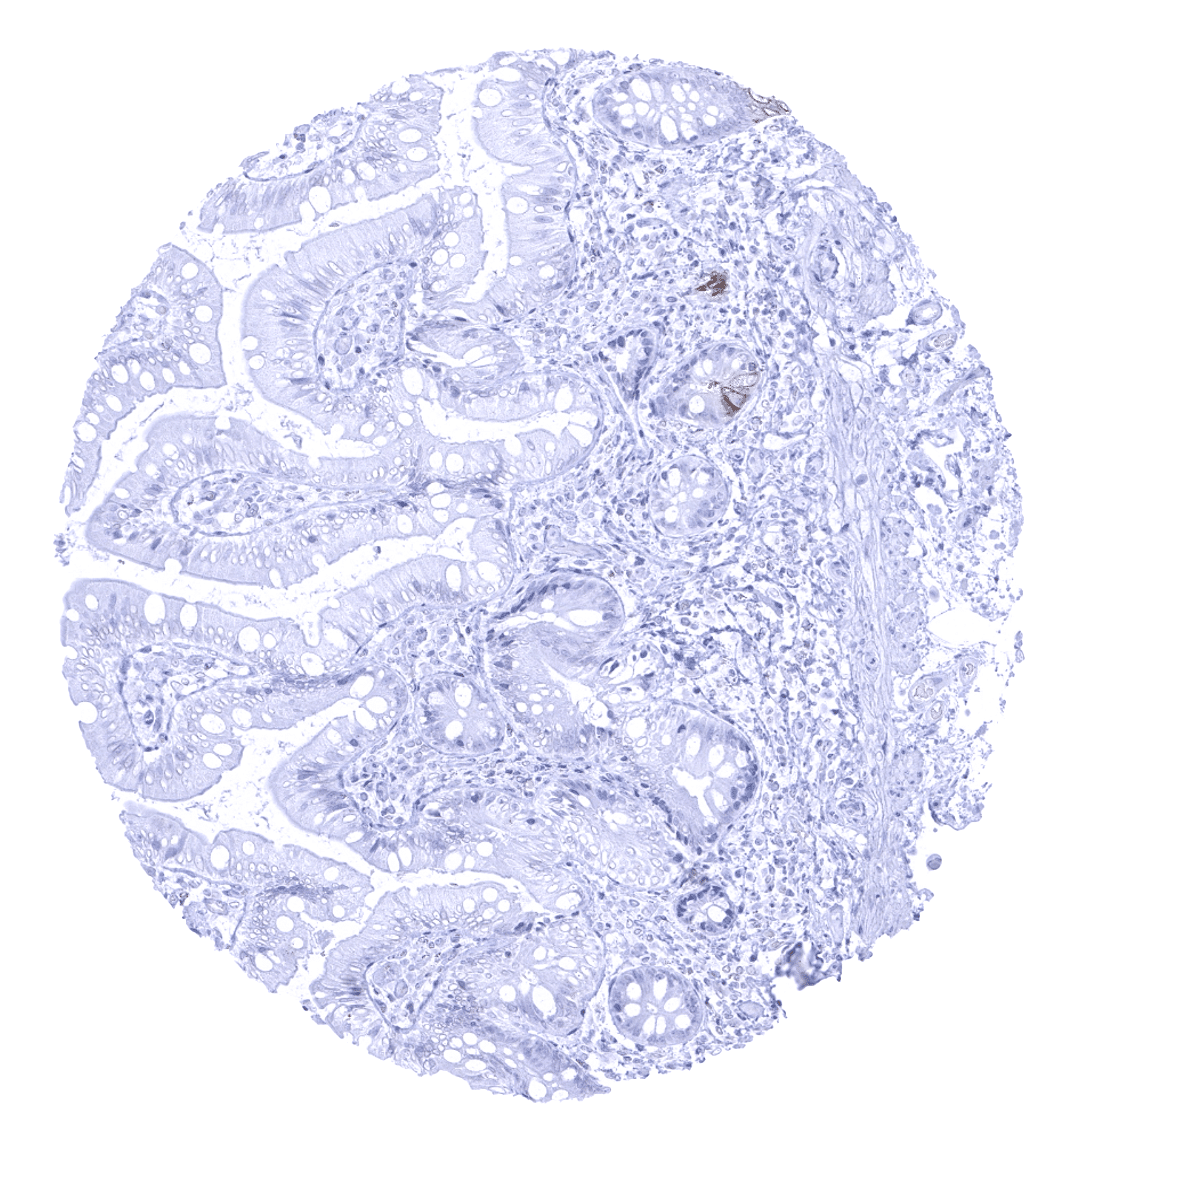
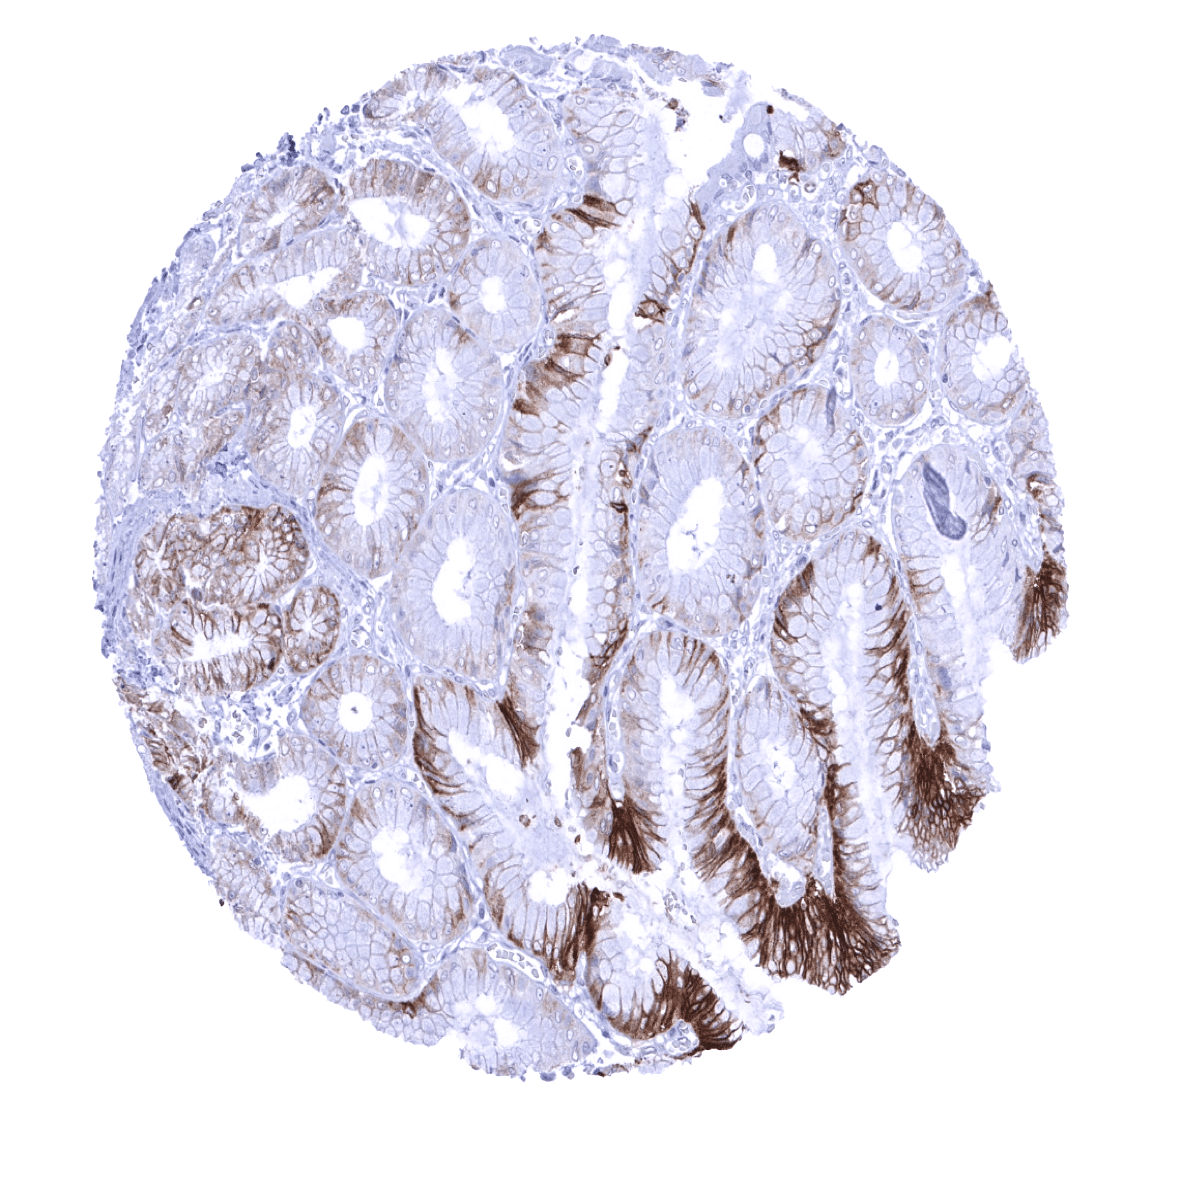
| Colon | Few scattered Trop-2 positive epithelial cells. | |
| Rectum | Few scattered Trop-2 positive epithelial cells. | |
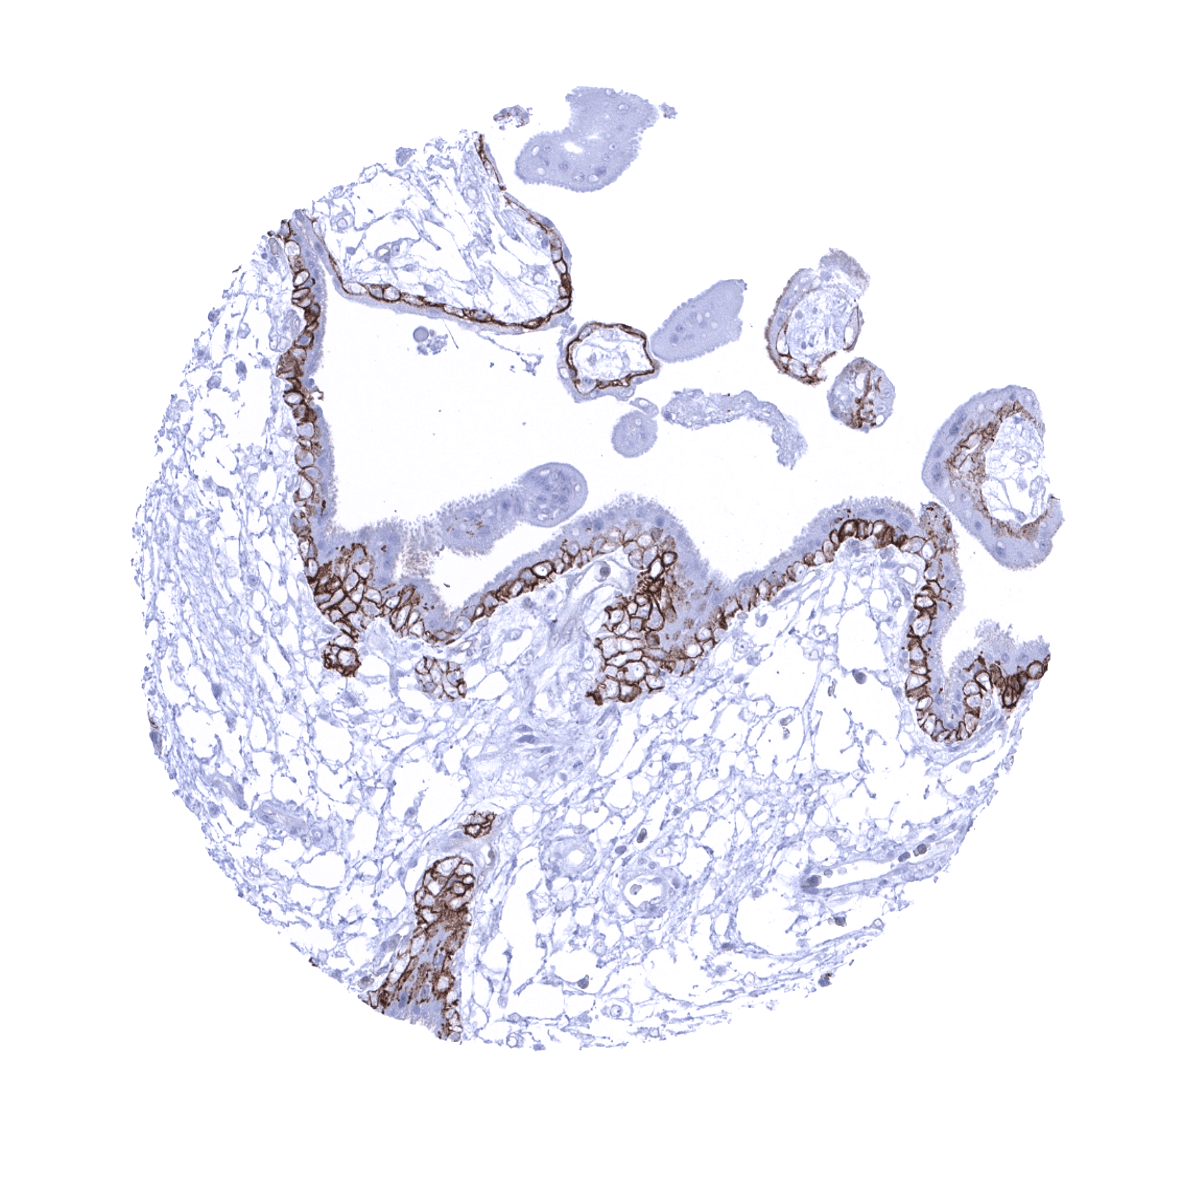
| Liver | Strong Trop-2 staining of intrahepatic bile ducts. Hepatocytes are negative. | |
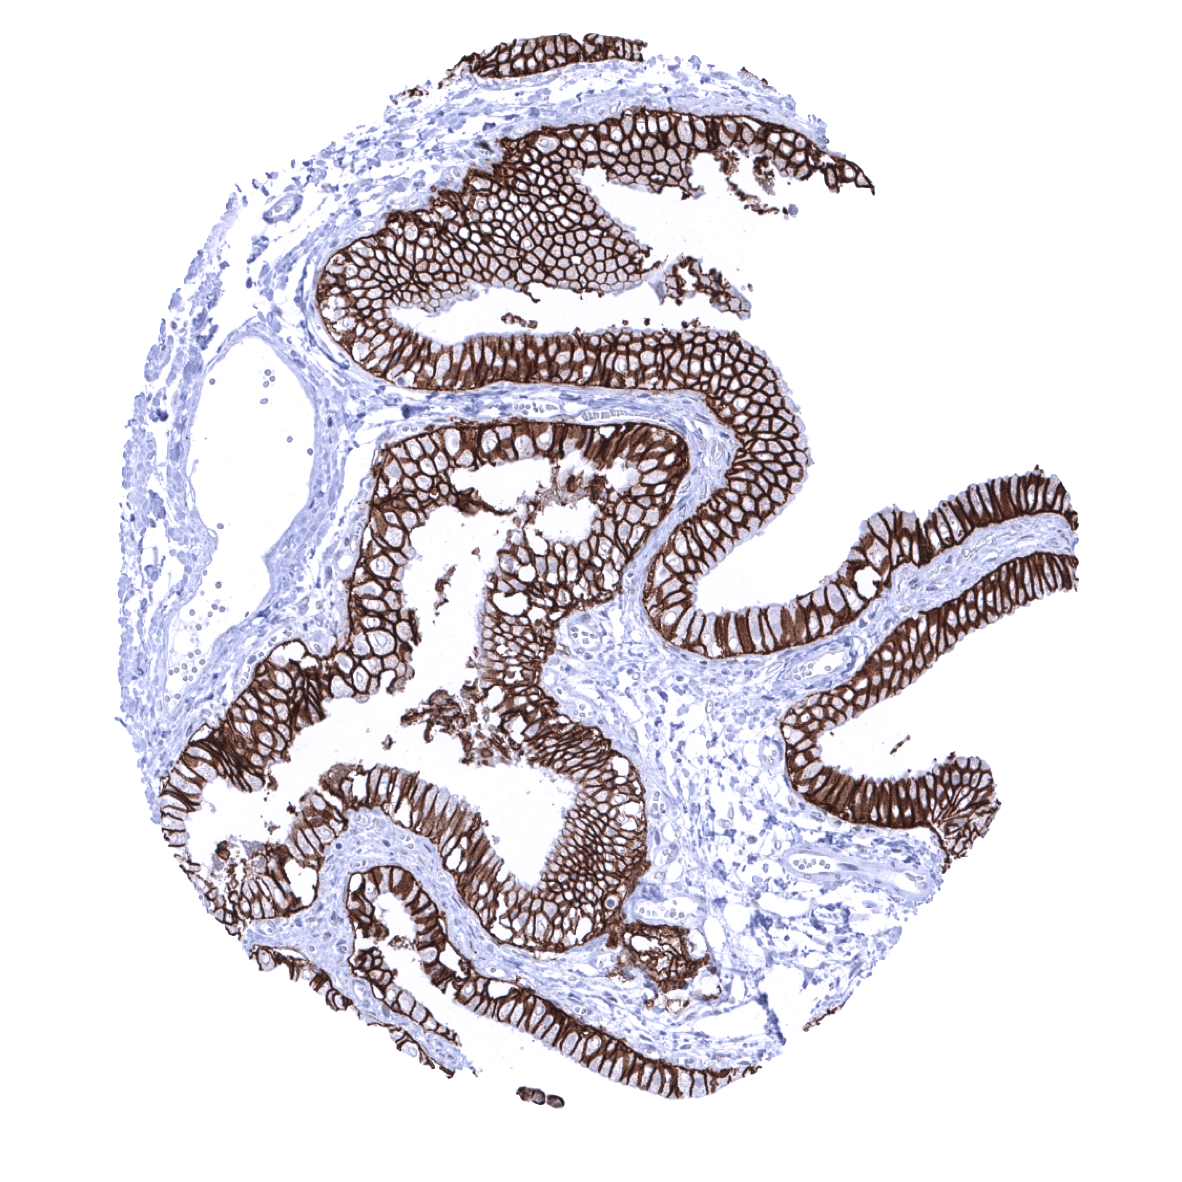
| Gallbladder | Strong Trop-2 staining of all epithelial cells. | |
| Pancreas | Strong Trop-2 staining of excretory and intercalated ducts. Variable staining of acinar cells, predominantly occurring at apical membranes. | |
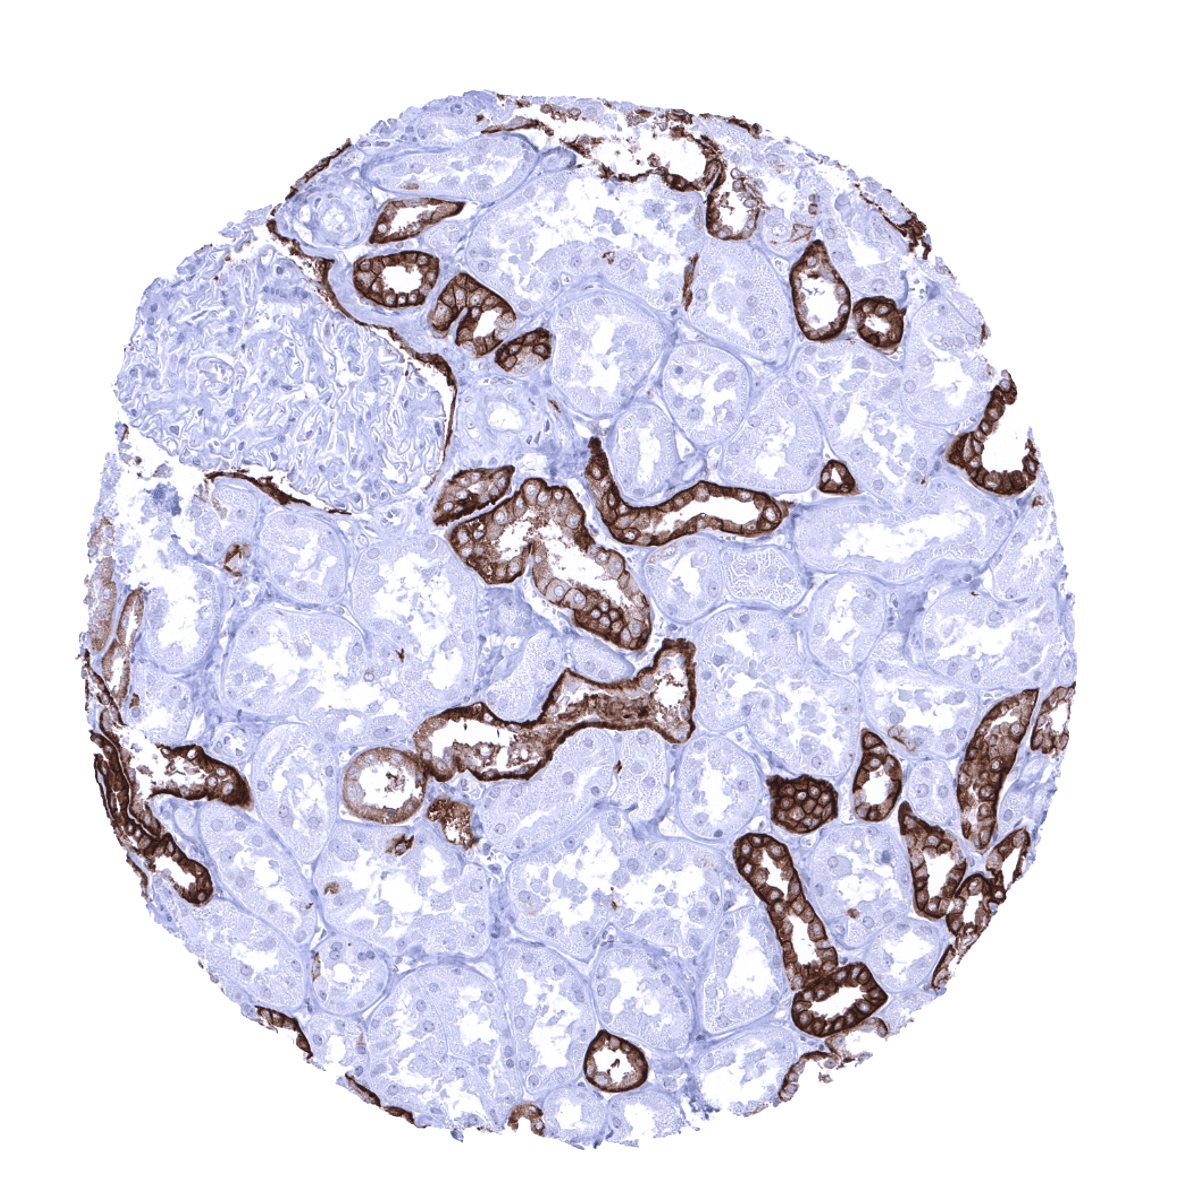
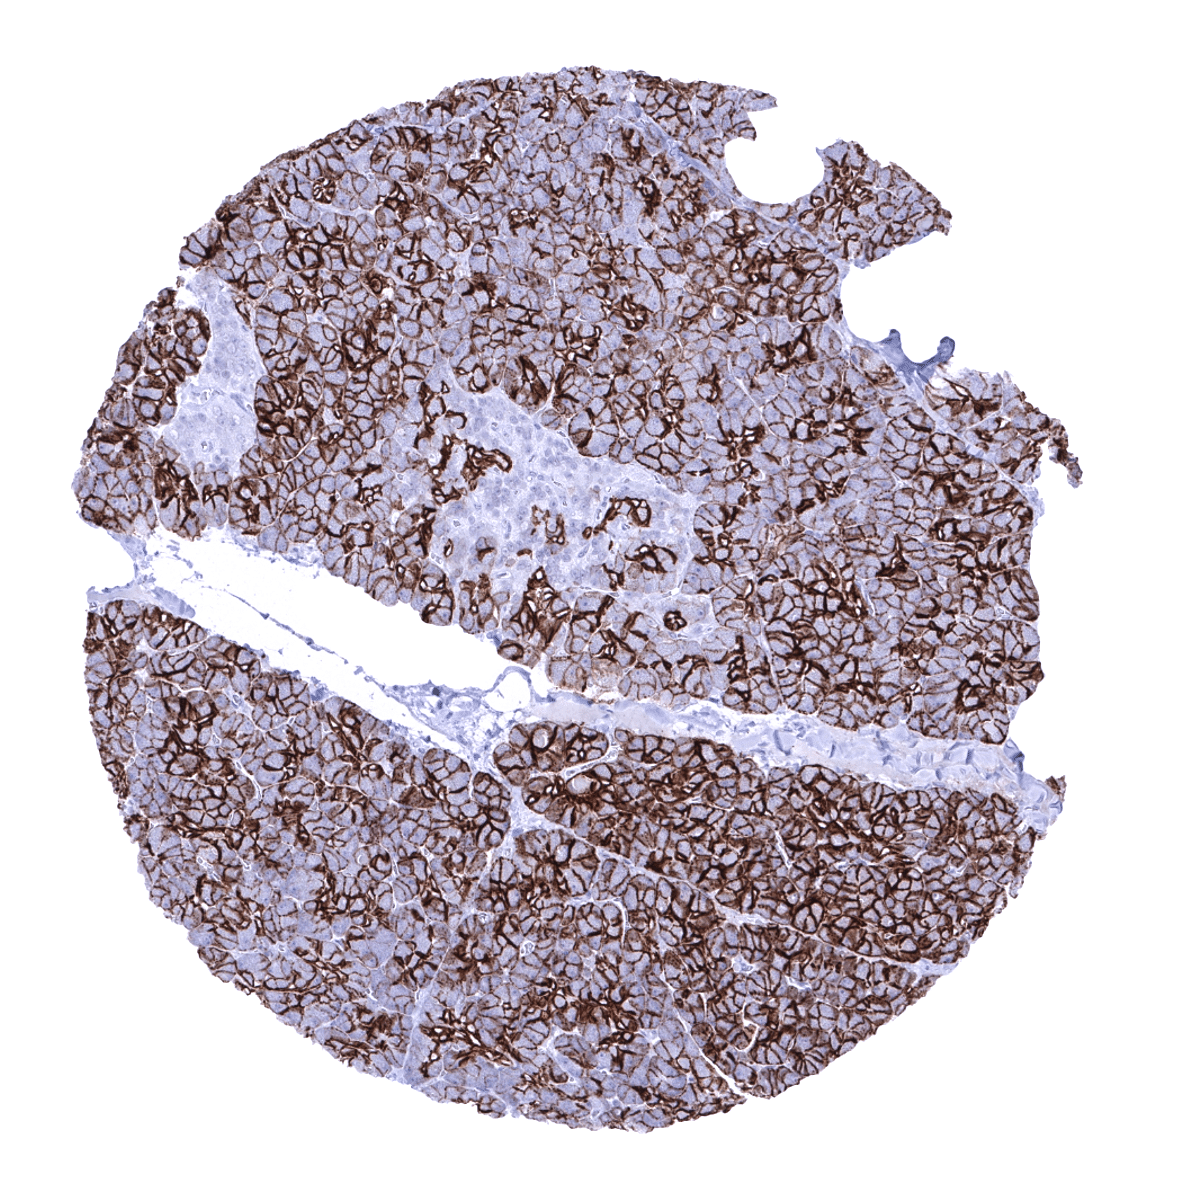
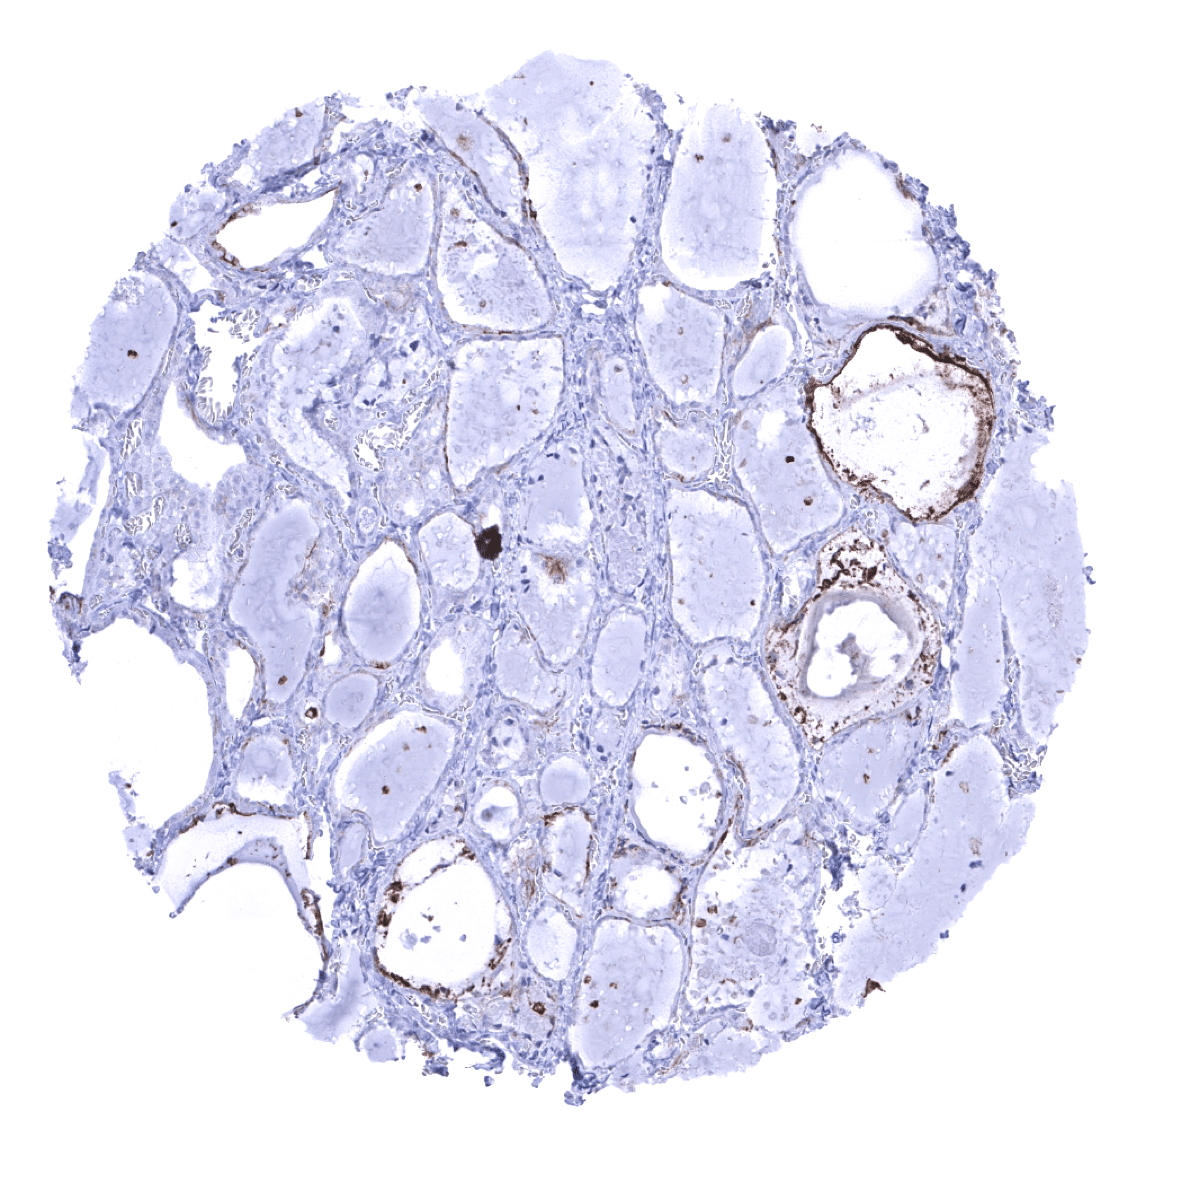
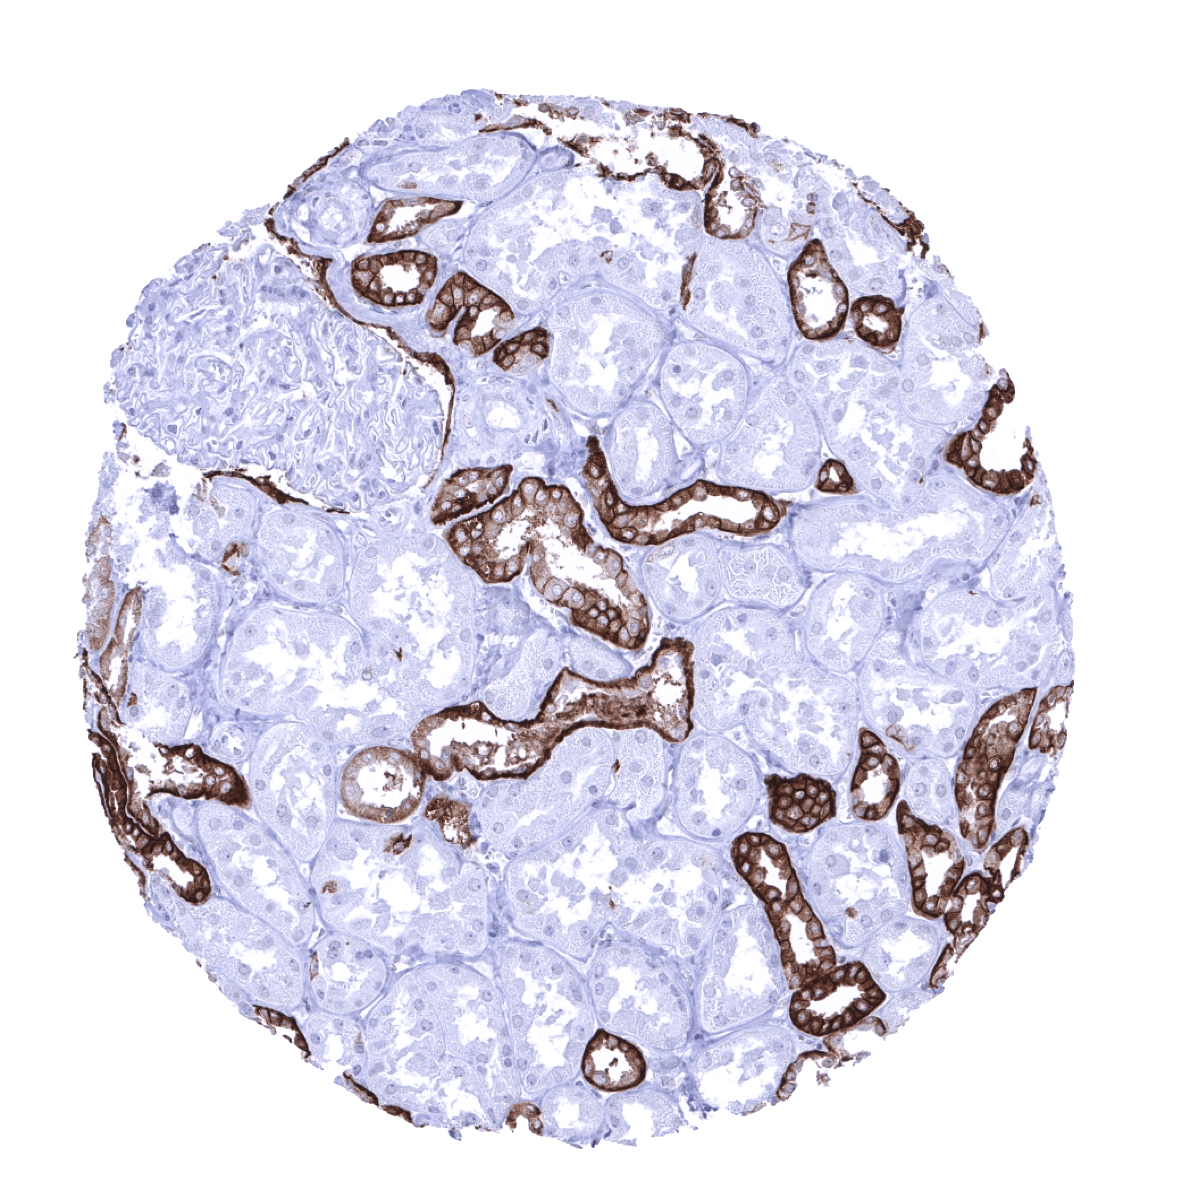
| Genitourinary | Kidney | Strong Trop-2 positivity in distal tubuli and collecting ducts. Weak to moderate staining of the parietal layer of the Bowman capsule. |
| Urothelium | Strong Trop-2 staining of all epithelial cells. | |
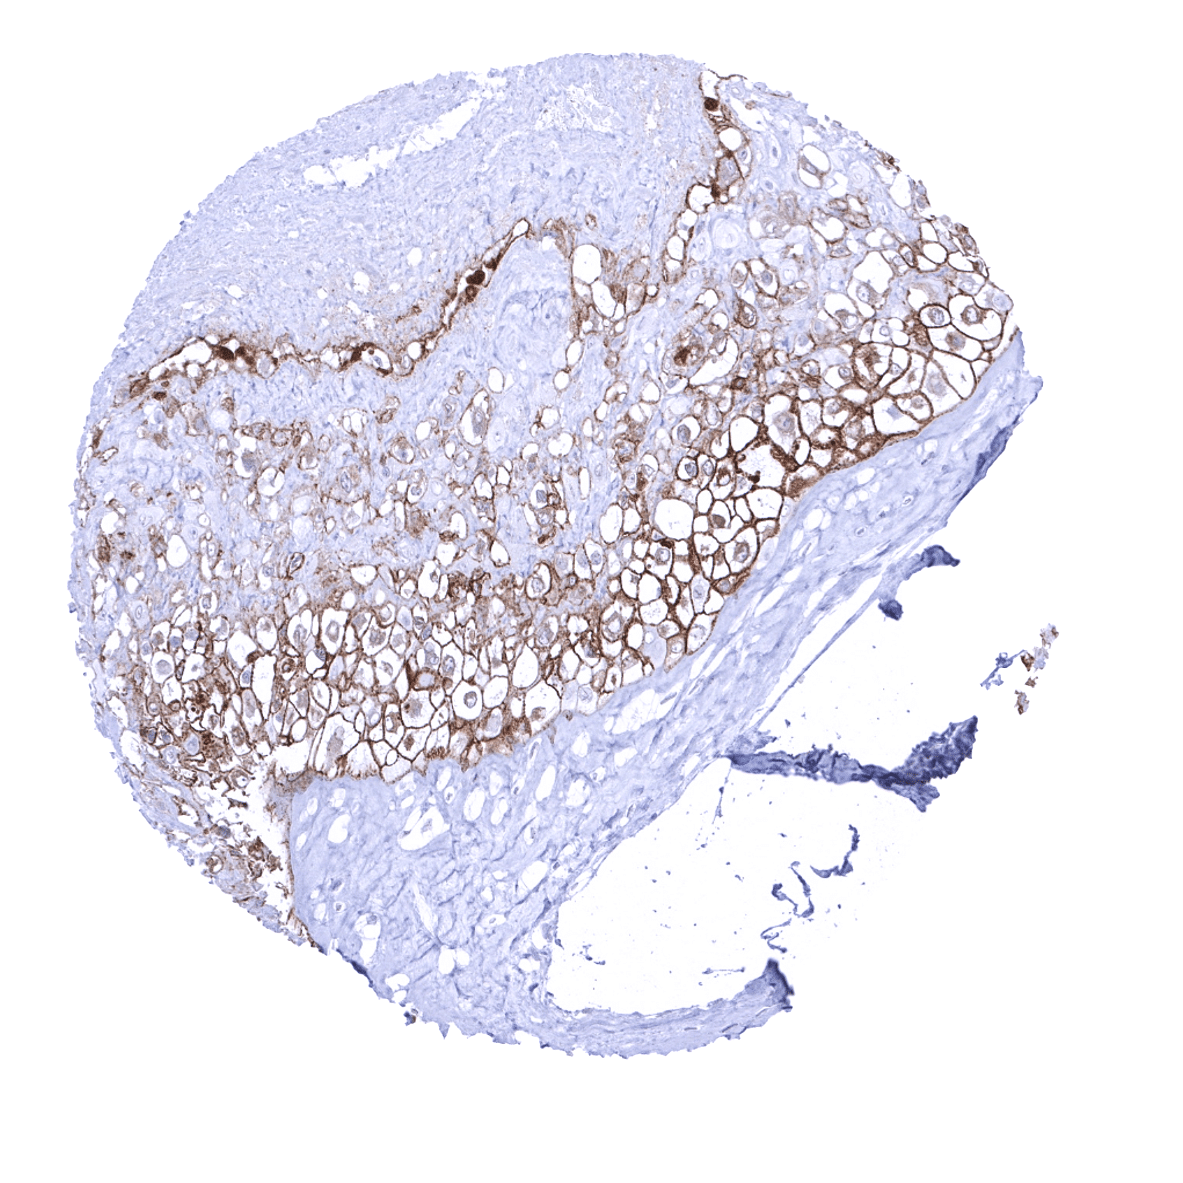
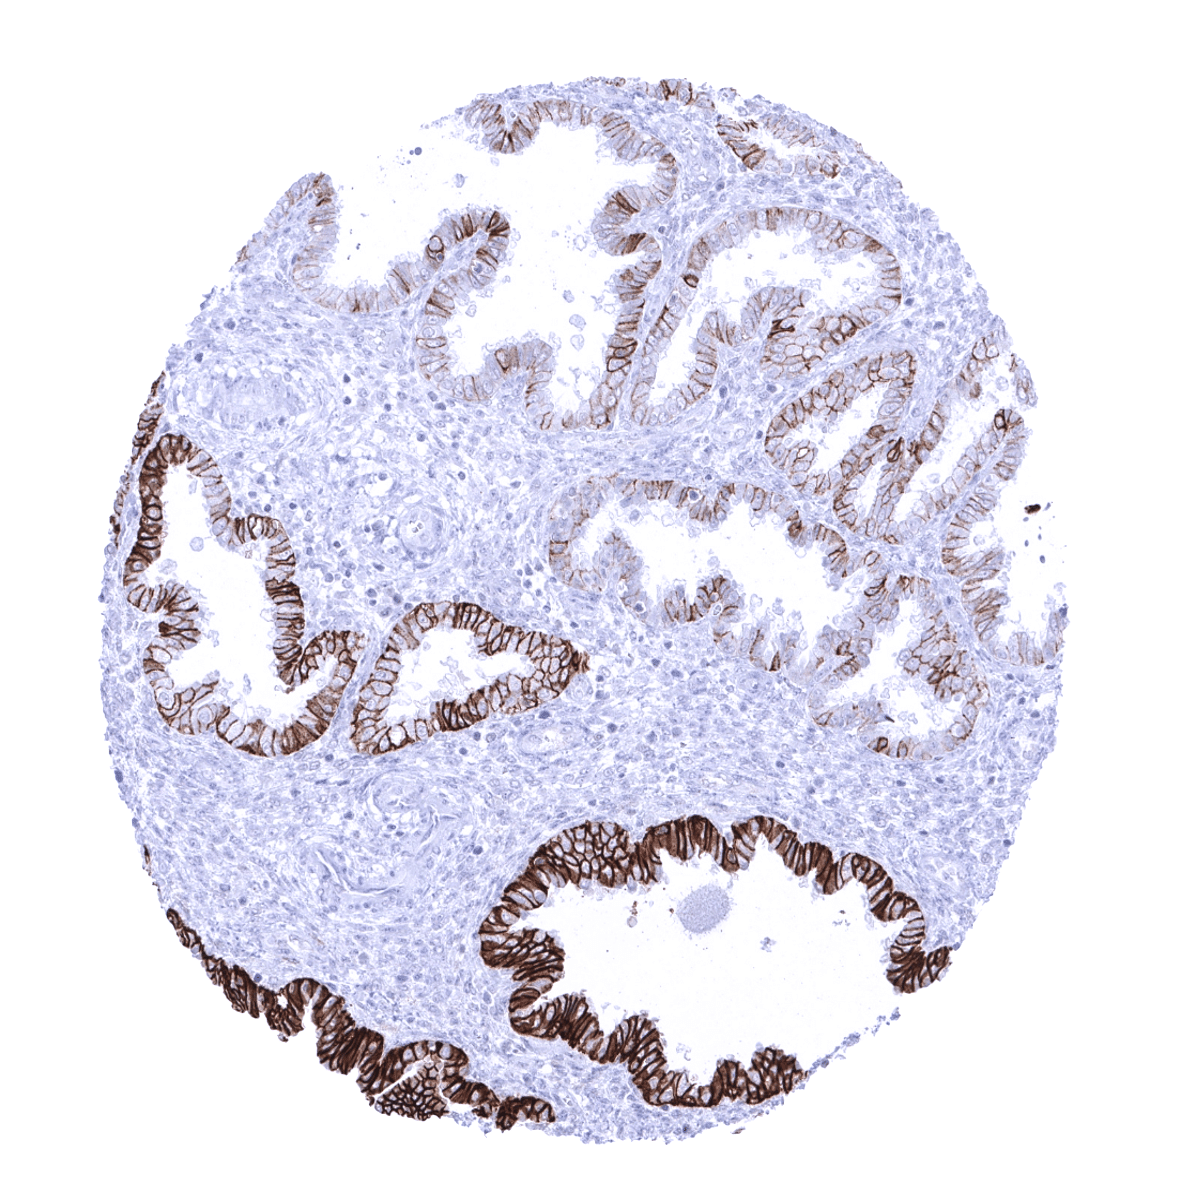
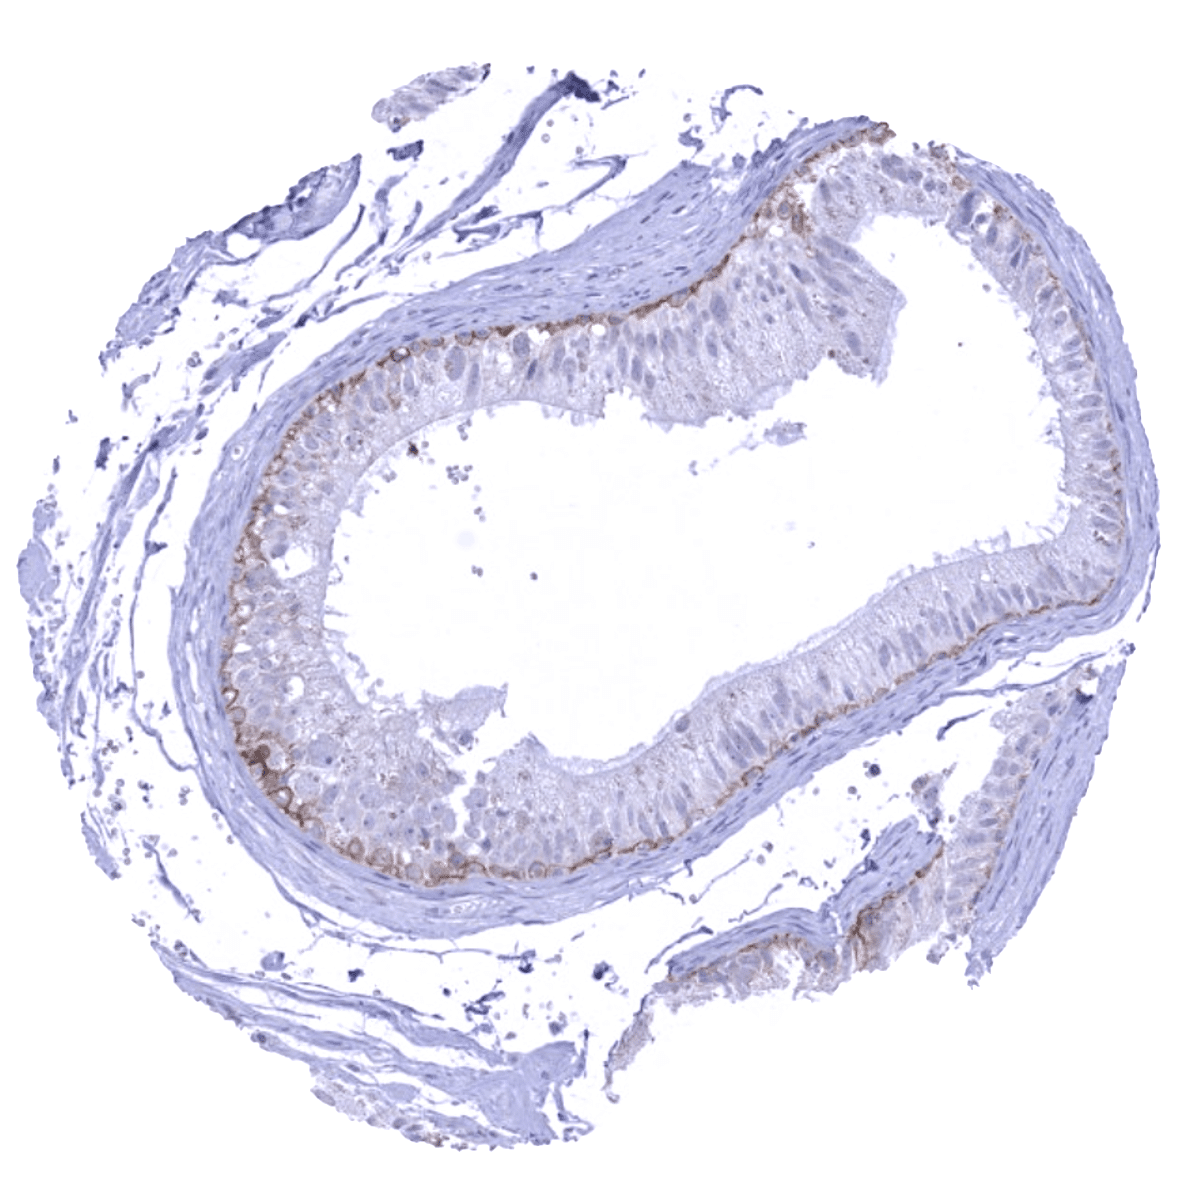
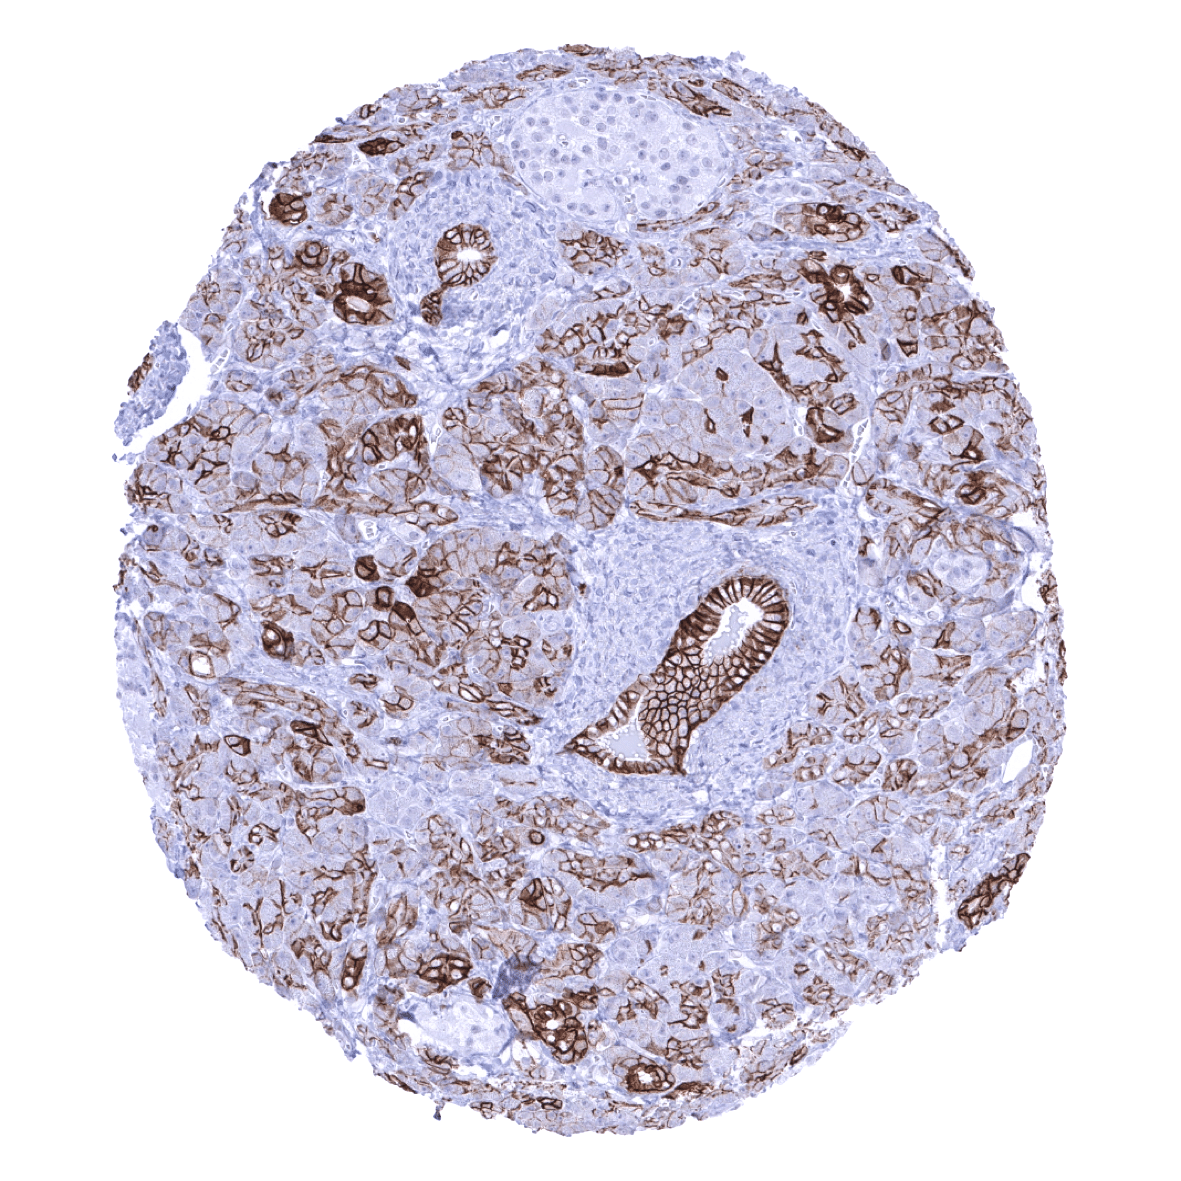
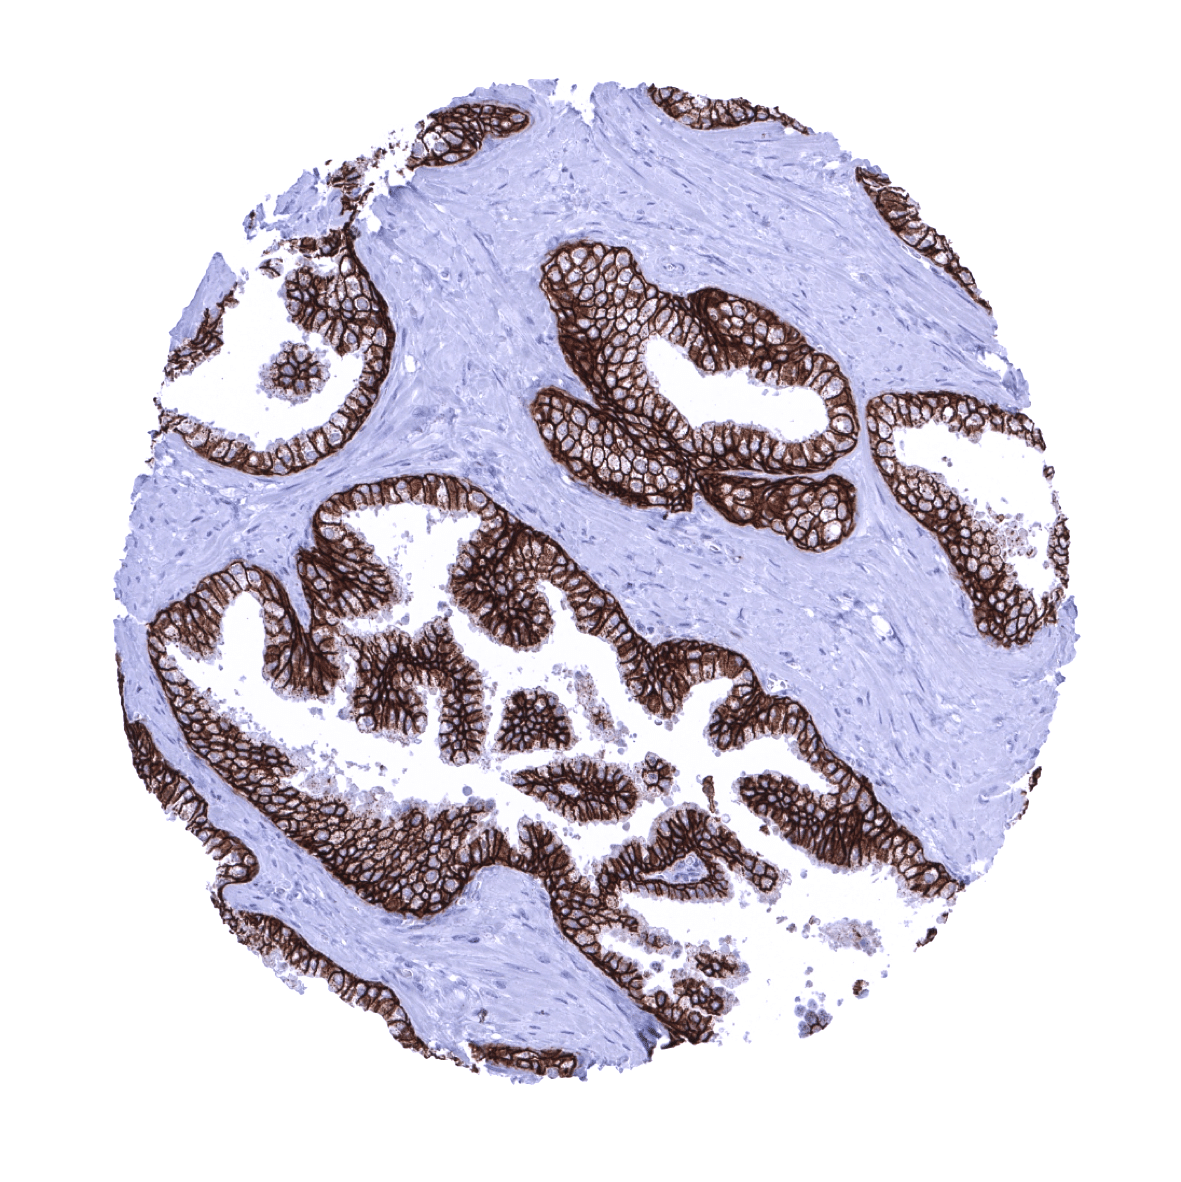
| Male genital | Prostate | Strong Trop-2 staining of all epithelial cells but less intense in basal cells. |
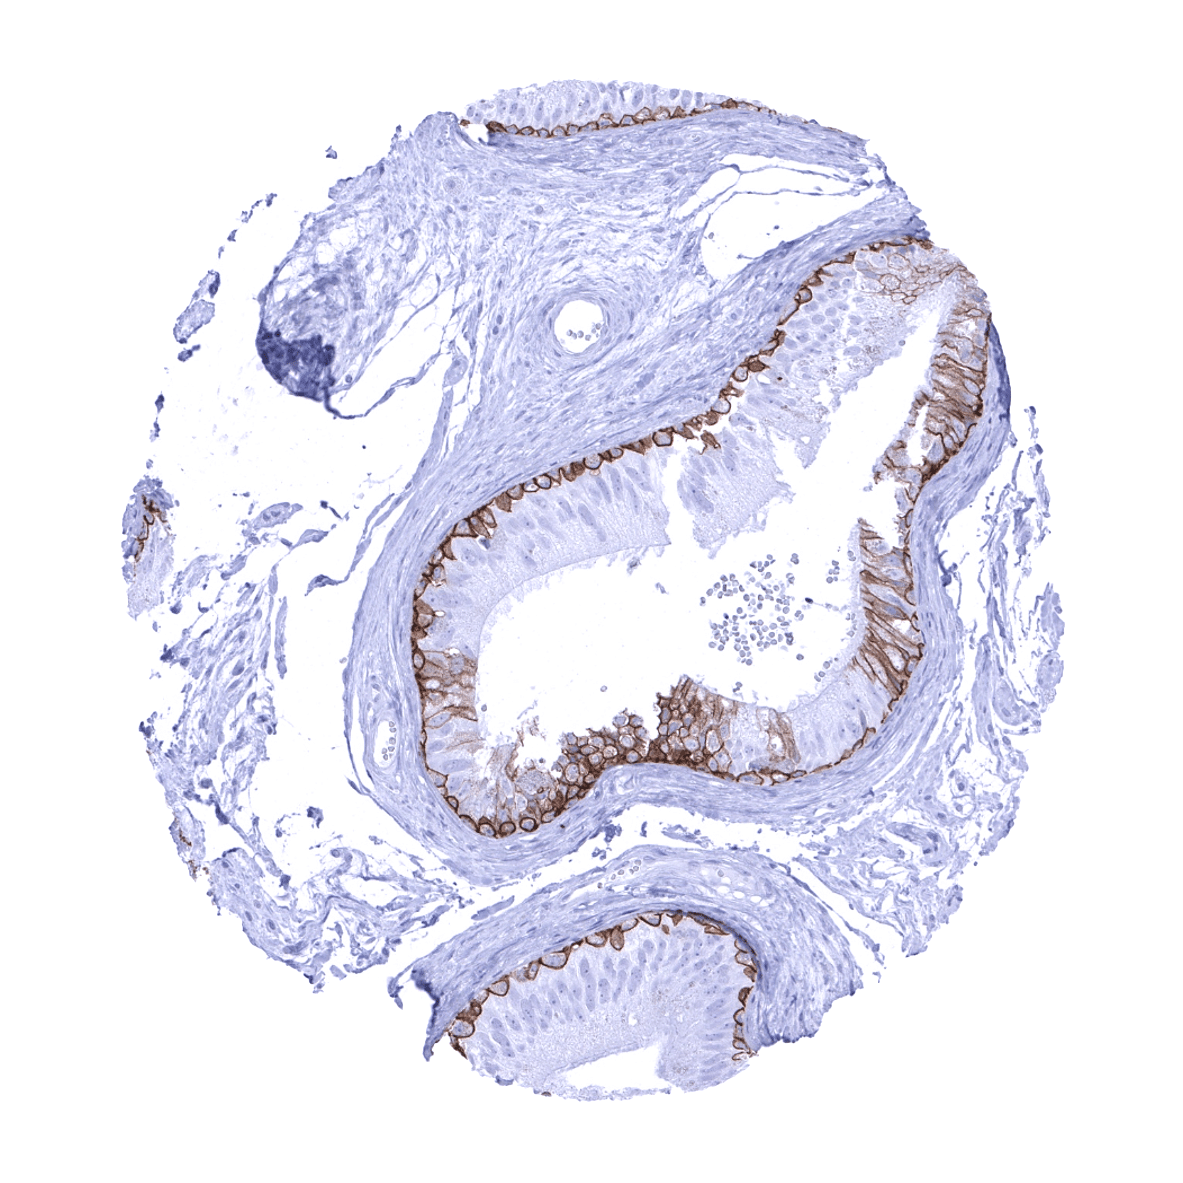
| Seminal vesicles | Strong Trop-2 staining of most epithelial cells. | |
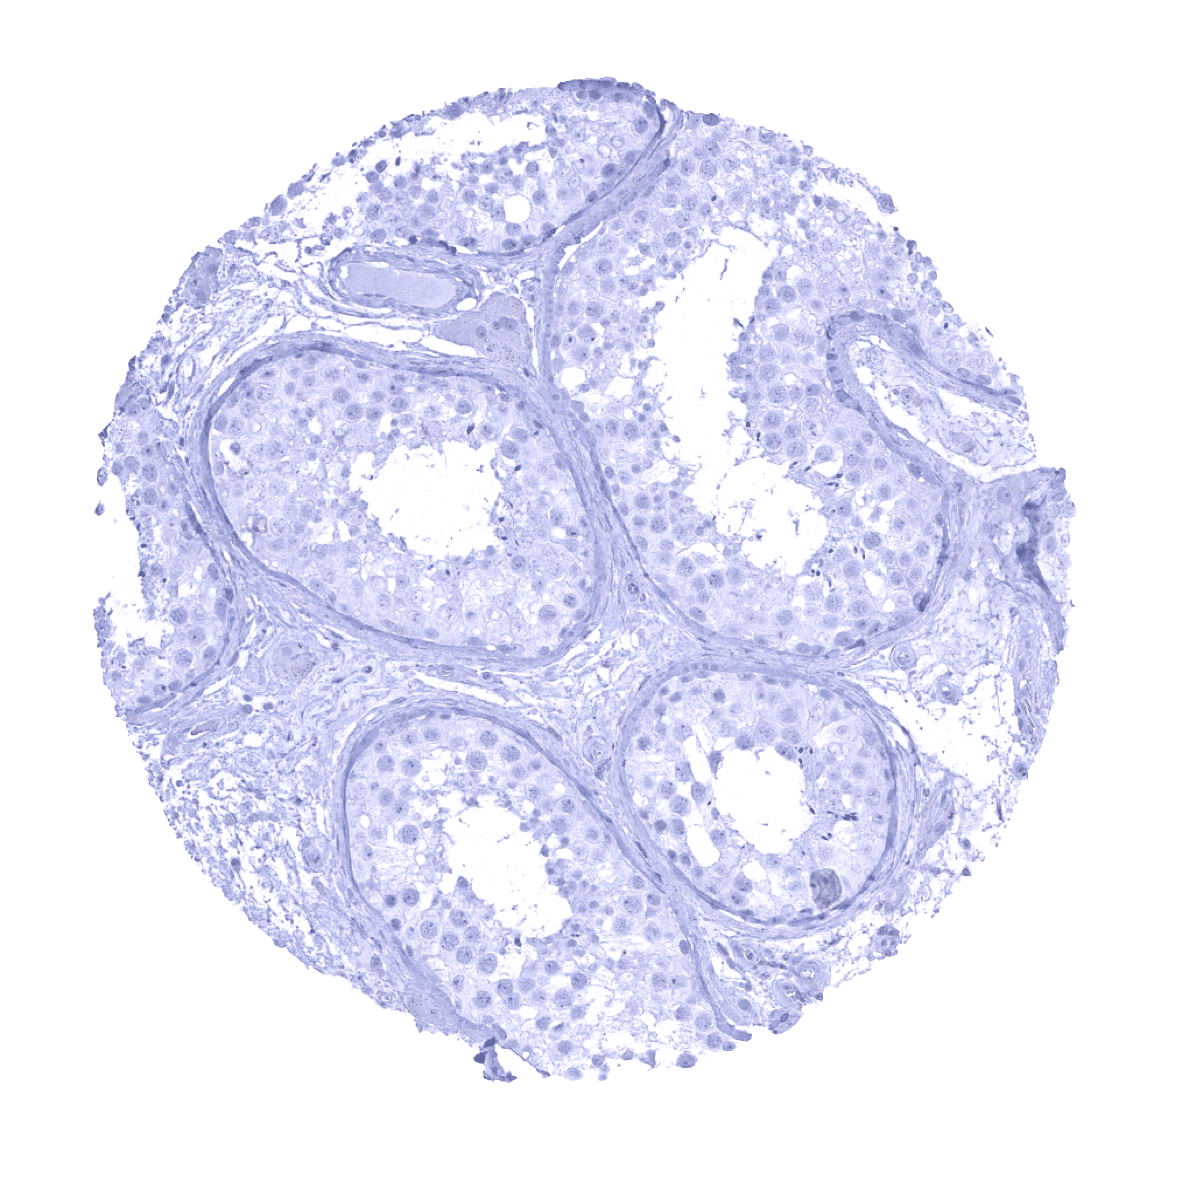
| Testis | Negative. | |
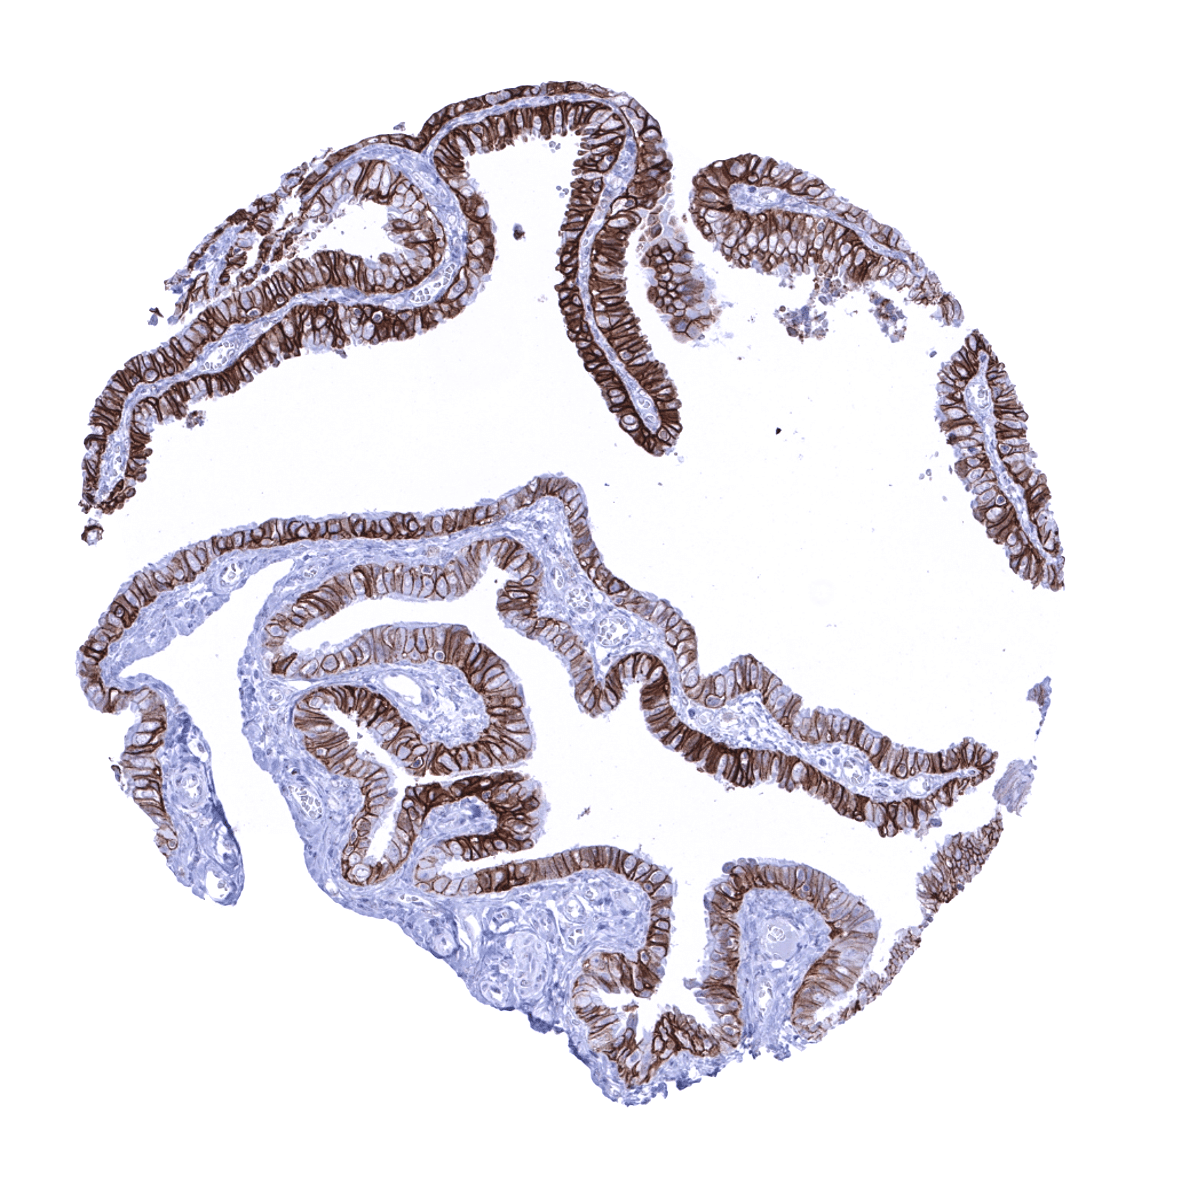
| Epididymis | Strong Trop-2 staining of epithelial cells of the cauda and of basal cells in the corpus. Staining is less intense and variable in tall columnar cells. | |
| Female genital | Breast | Strong Trop-2 staining of all epithelial cells. |
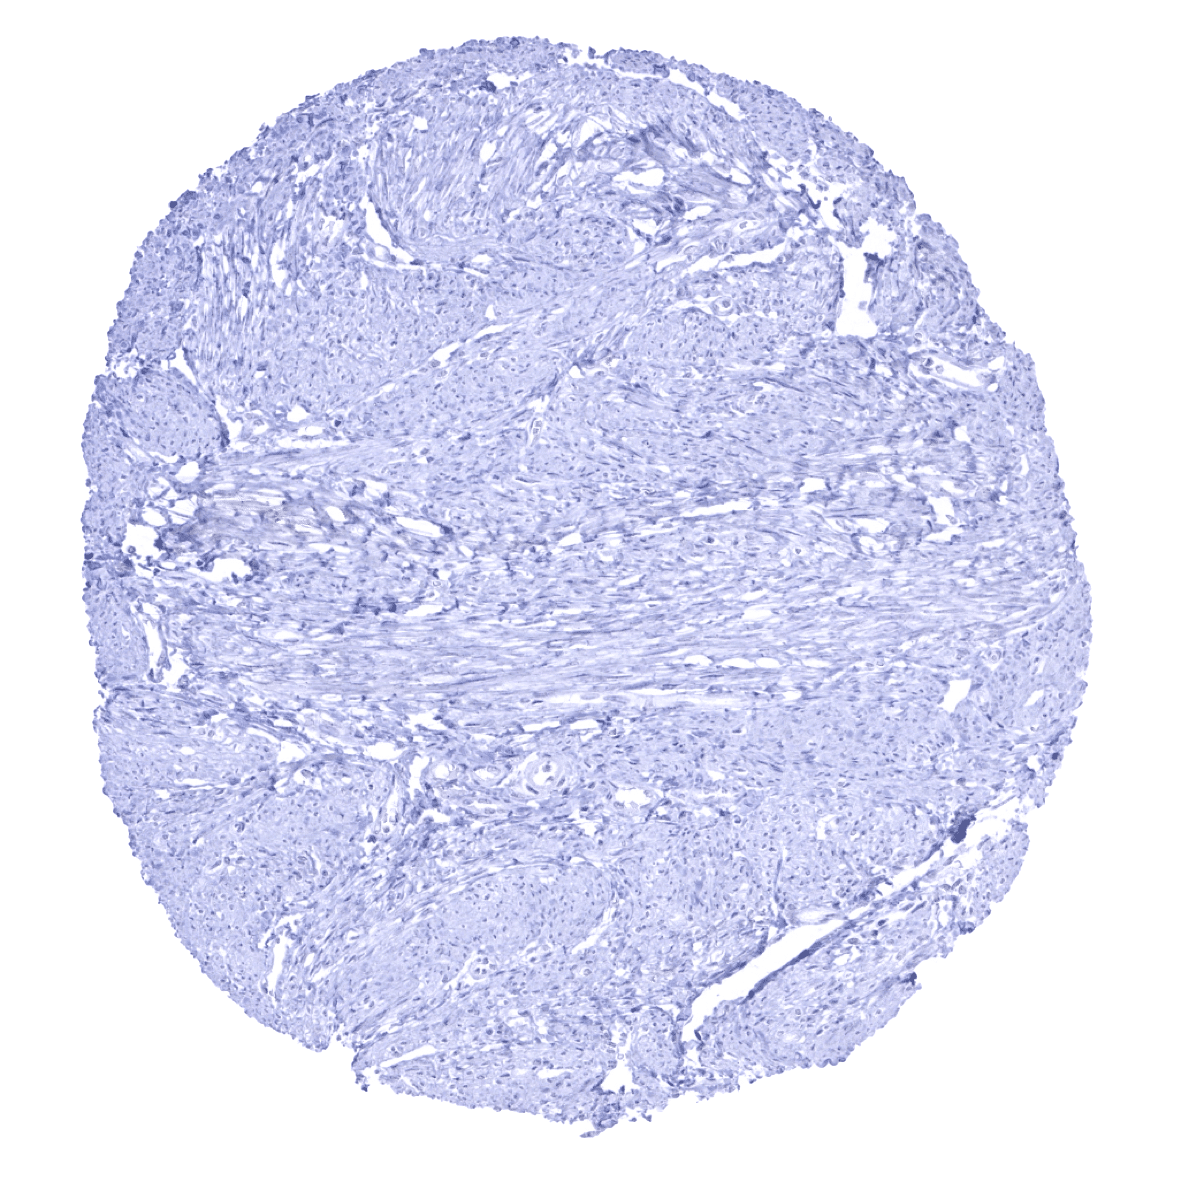
| Uterus, myometrium | Negative. | |
| Uterus, ectocervix | Strong Trop-2 staining of all squamous epithelial cells. | |
| Uterus endocervix | Strong Trop-2 staining of all epithelial cells. | |
| Uterus, endometrium | Strong Trop-2 staining of most epithelial cells. Some glands can remain negative. | |
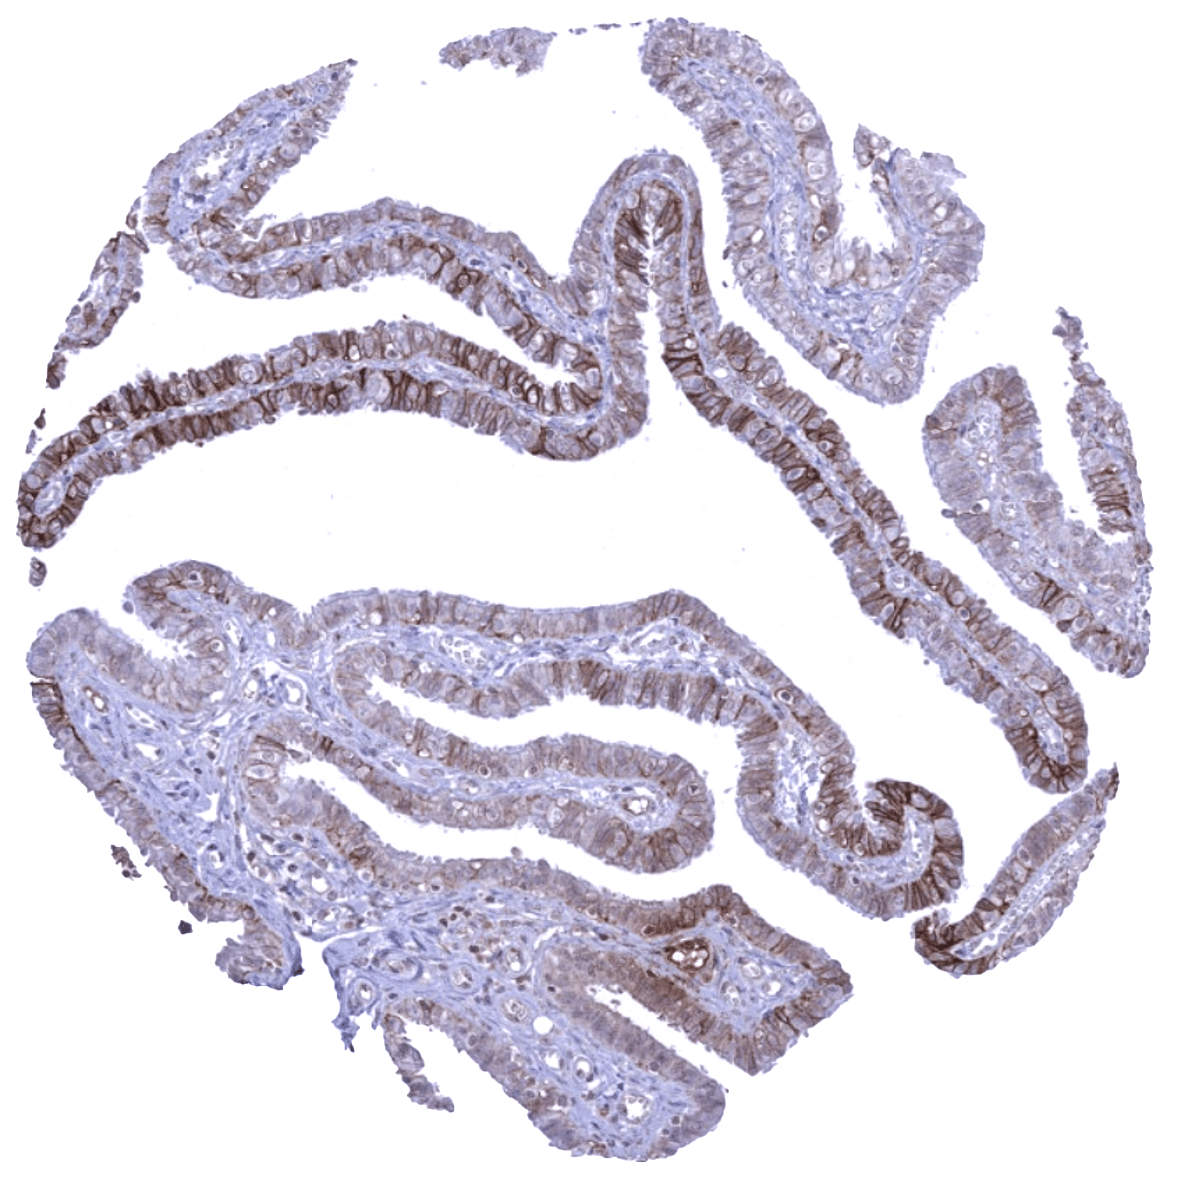
| Fallopian Tube | Strong Trop-2 staining of epithelial cells. | |
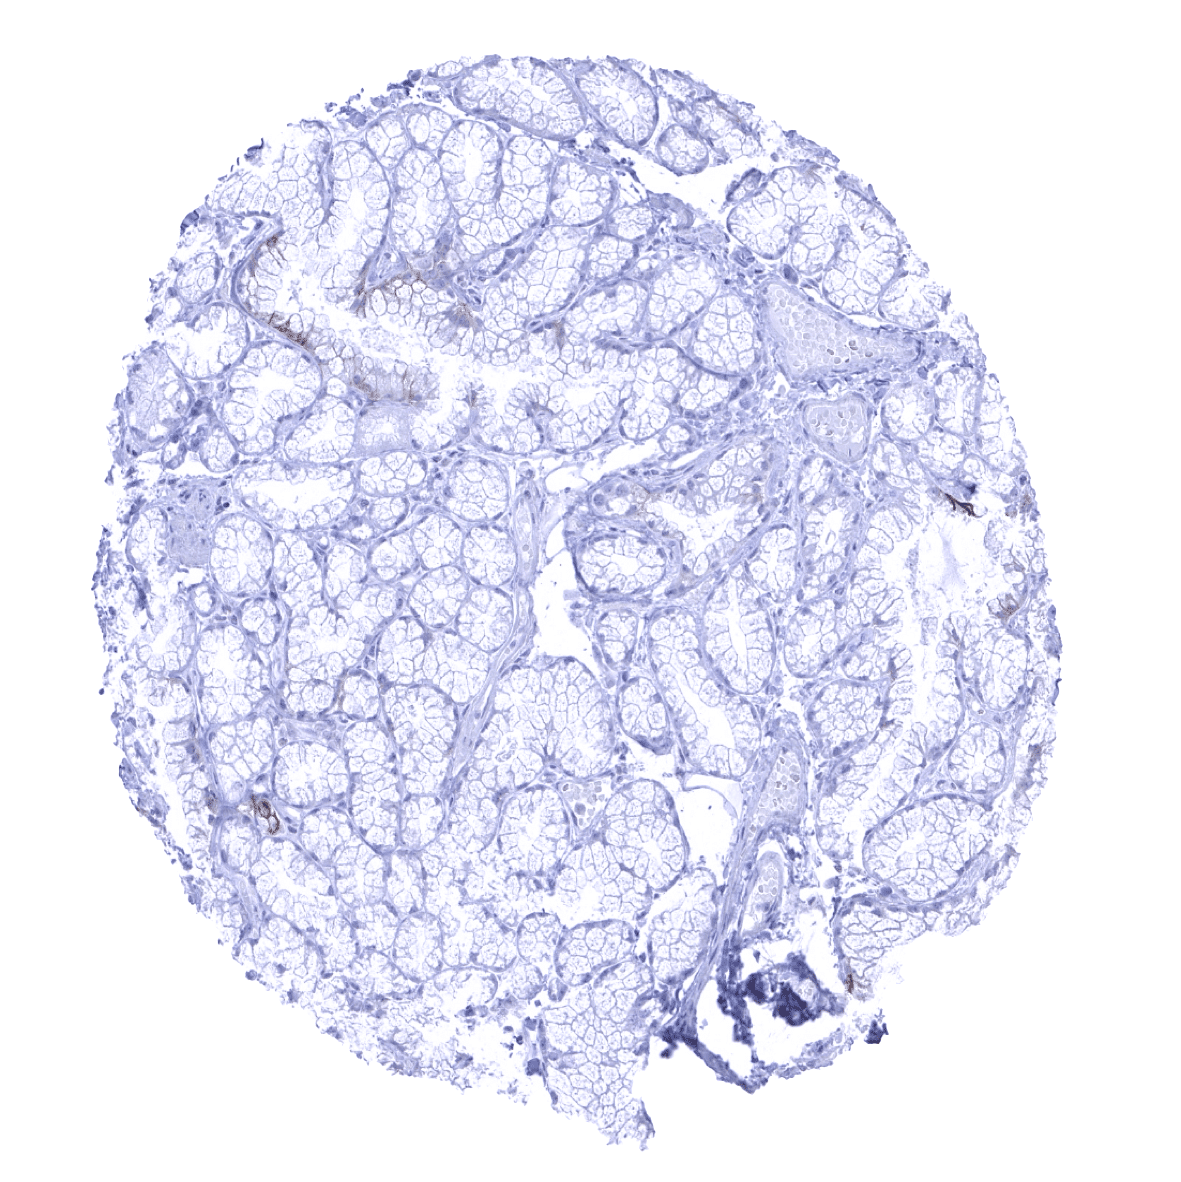
| Ovary | Negative. | |
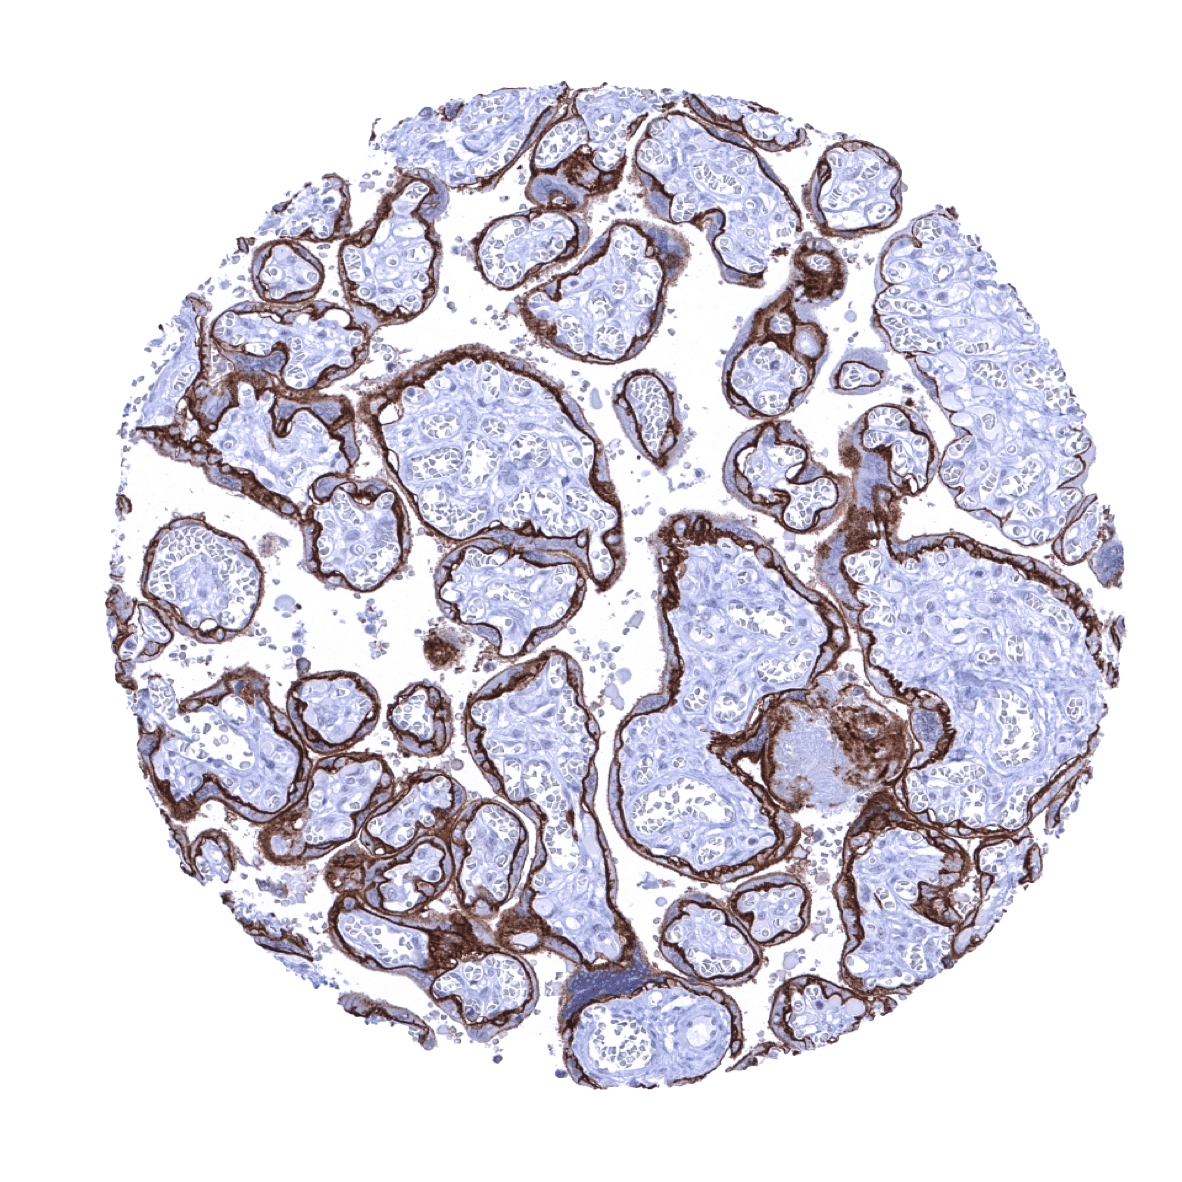
| Placenta early | Strong Trop-2 staining of the cytotrophoblast. | |
| Placenta mature | Strong Trop-2 staining of the cytotrophoblast. Moderate staining of the luminal membrane of the syncytiotrophoblast. Decidua cells are negative. | |
| Amnion | Strong Trop-2 staining of amnion cells. | |
| Chorion | Strong Trop-2 staining of chorion cells. | |
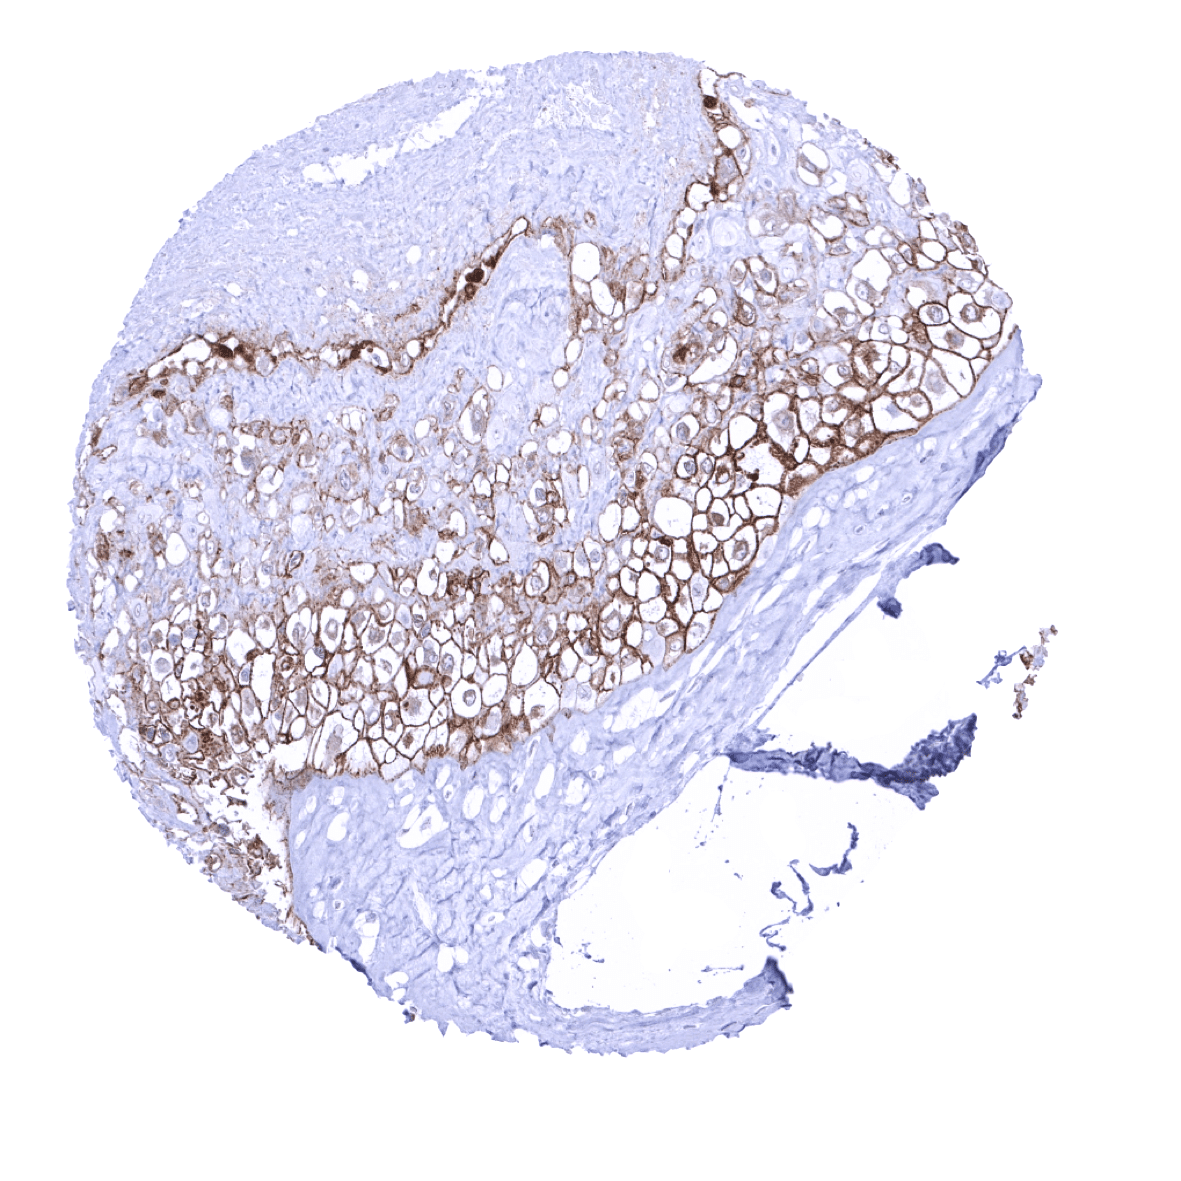
| Skin | Epidermis | Strong Trop-2 staining of all squamous epithelial cells, with the exception of basal cells which are negative or only weakly positive. |
| Sebaceous glands | Strong Trop-2 staining of all epithelial cells. | |
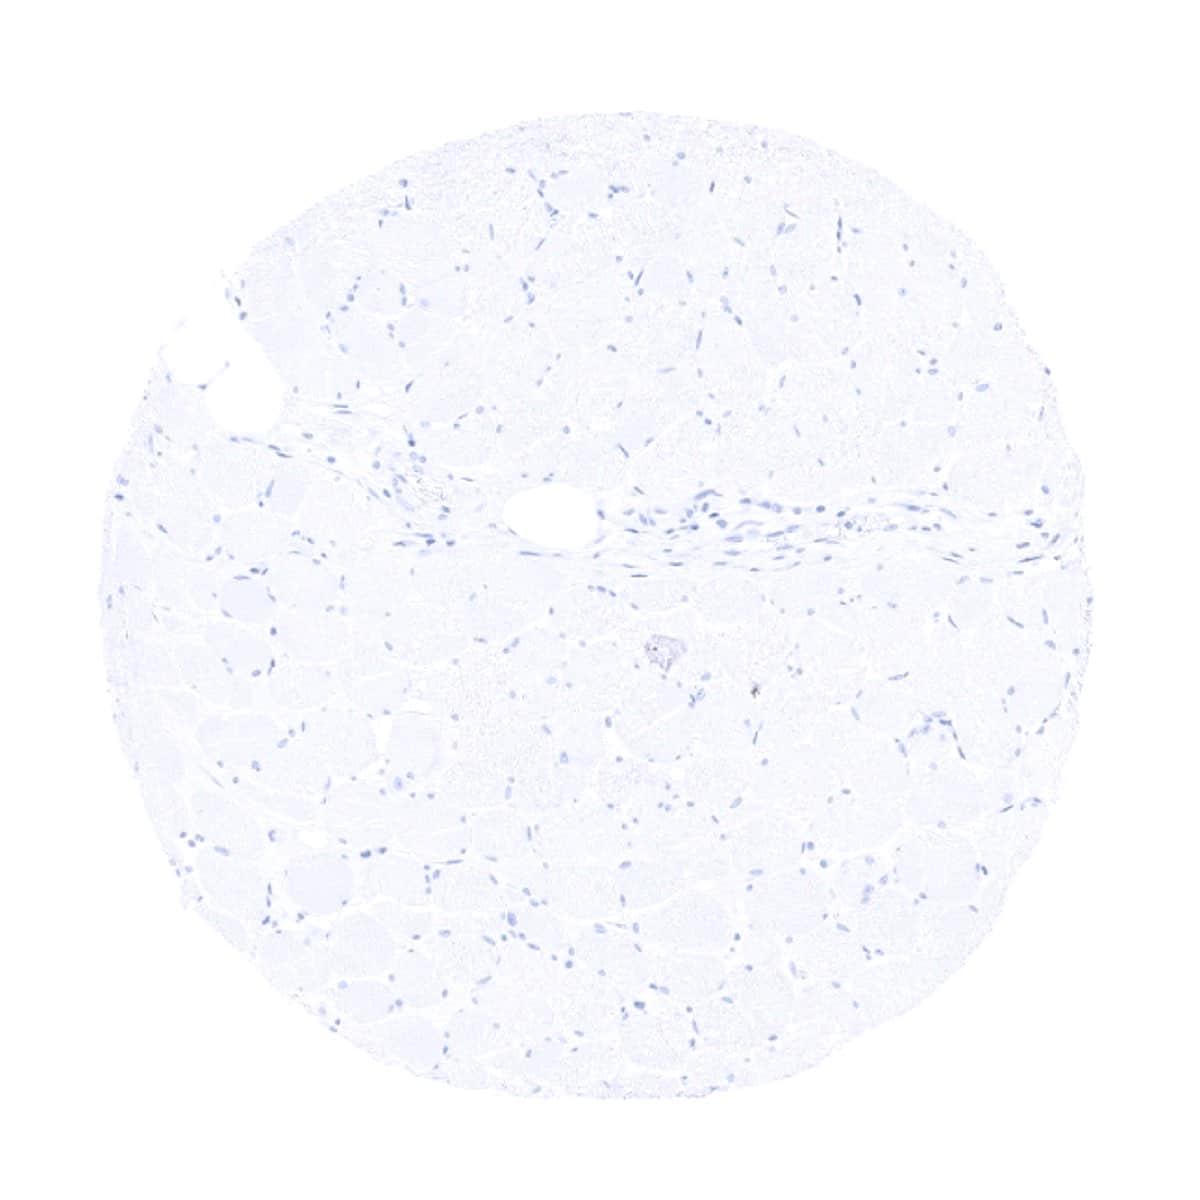
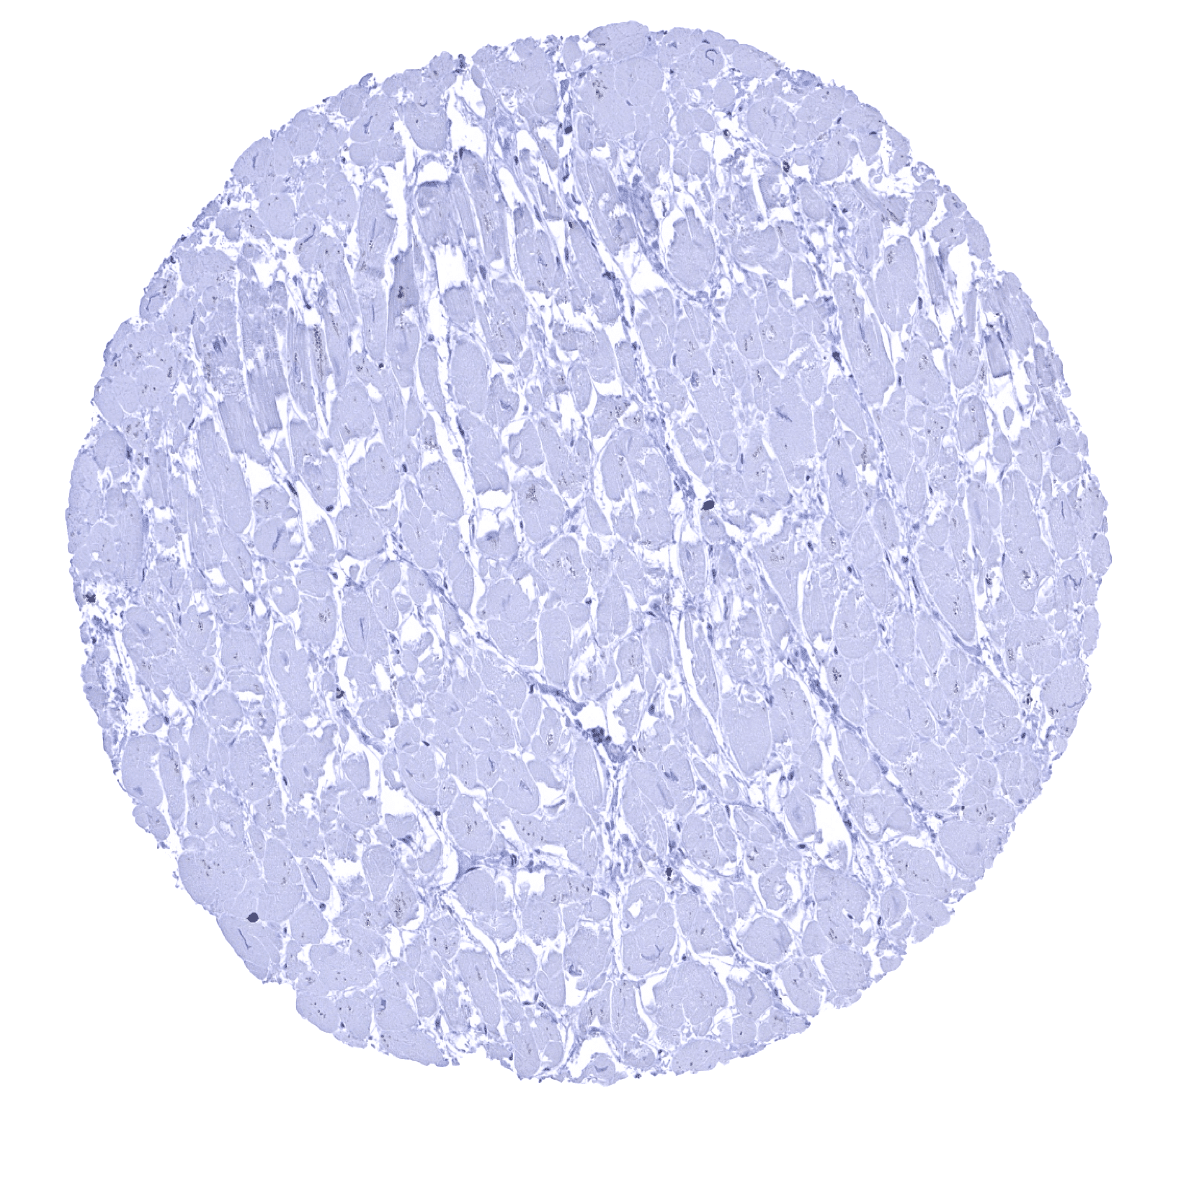
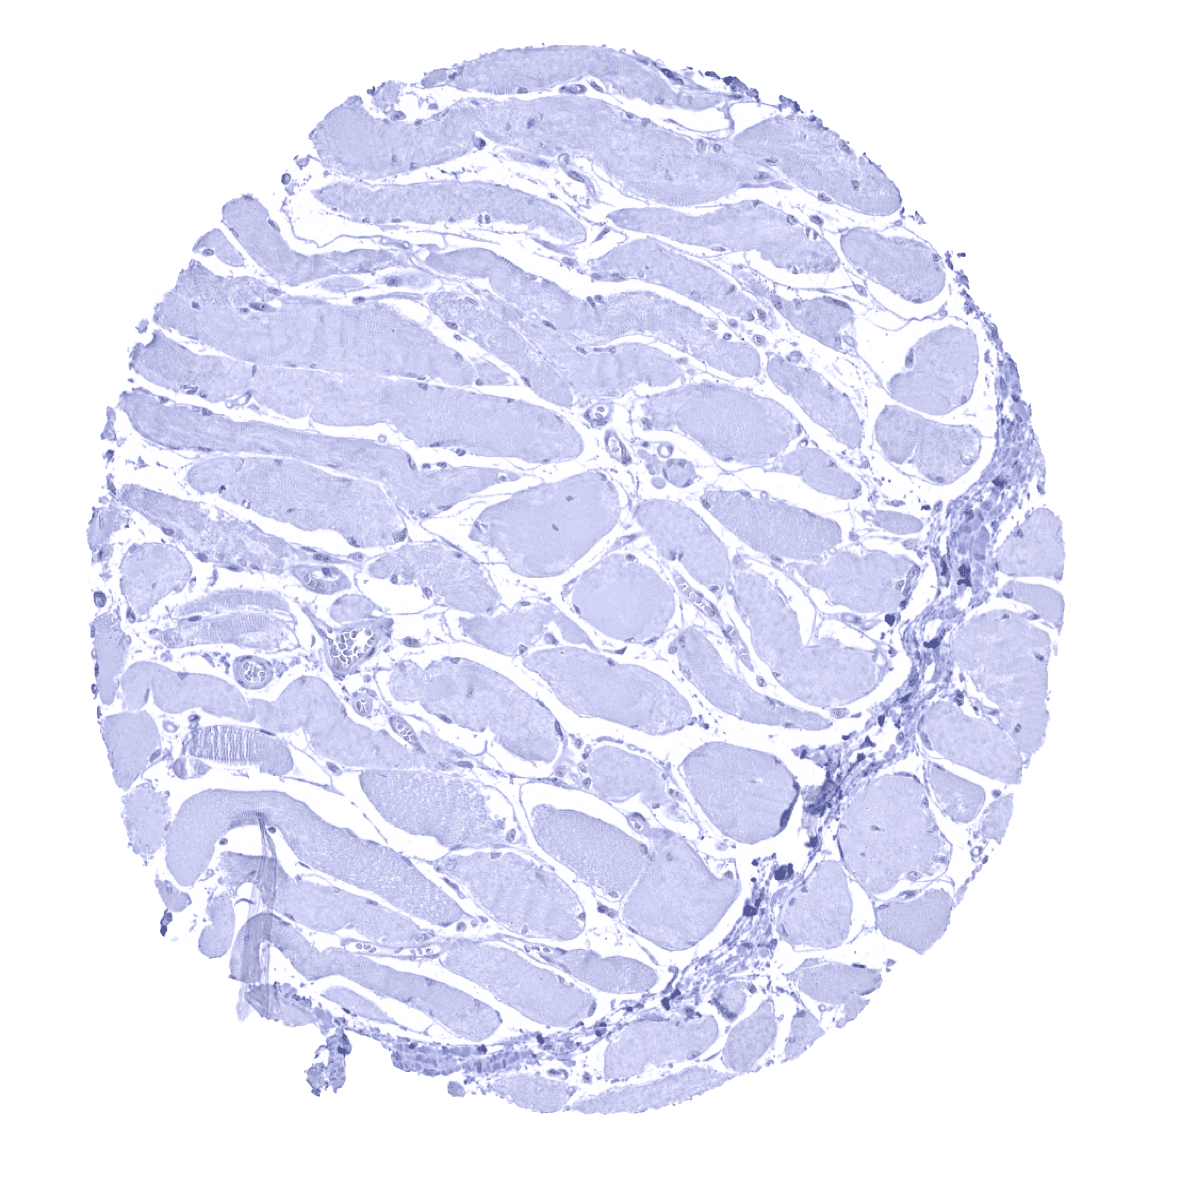
| Muscle/connective tissue | Heart muscle | Negative. |
| Skeletal muscle | Negative. | |
| Smooth muscle | Negative. | |
| Vessel walls | Negative. | |
| Fat | Negative. | |
| Stroma | Negative. | |
| Endothelium | Negative. | |
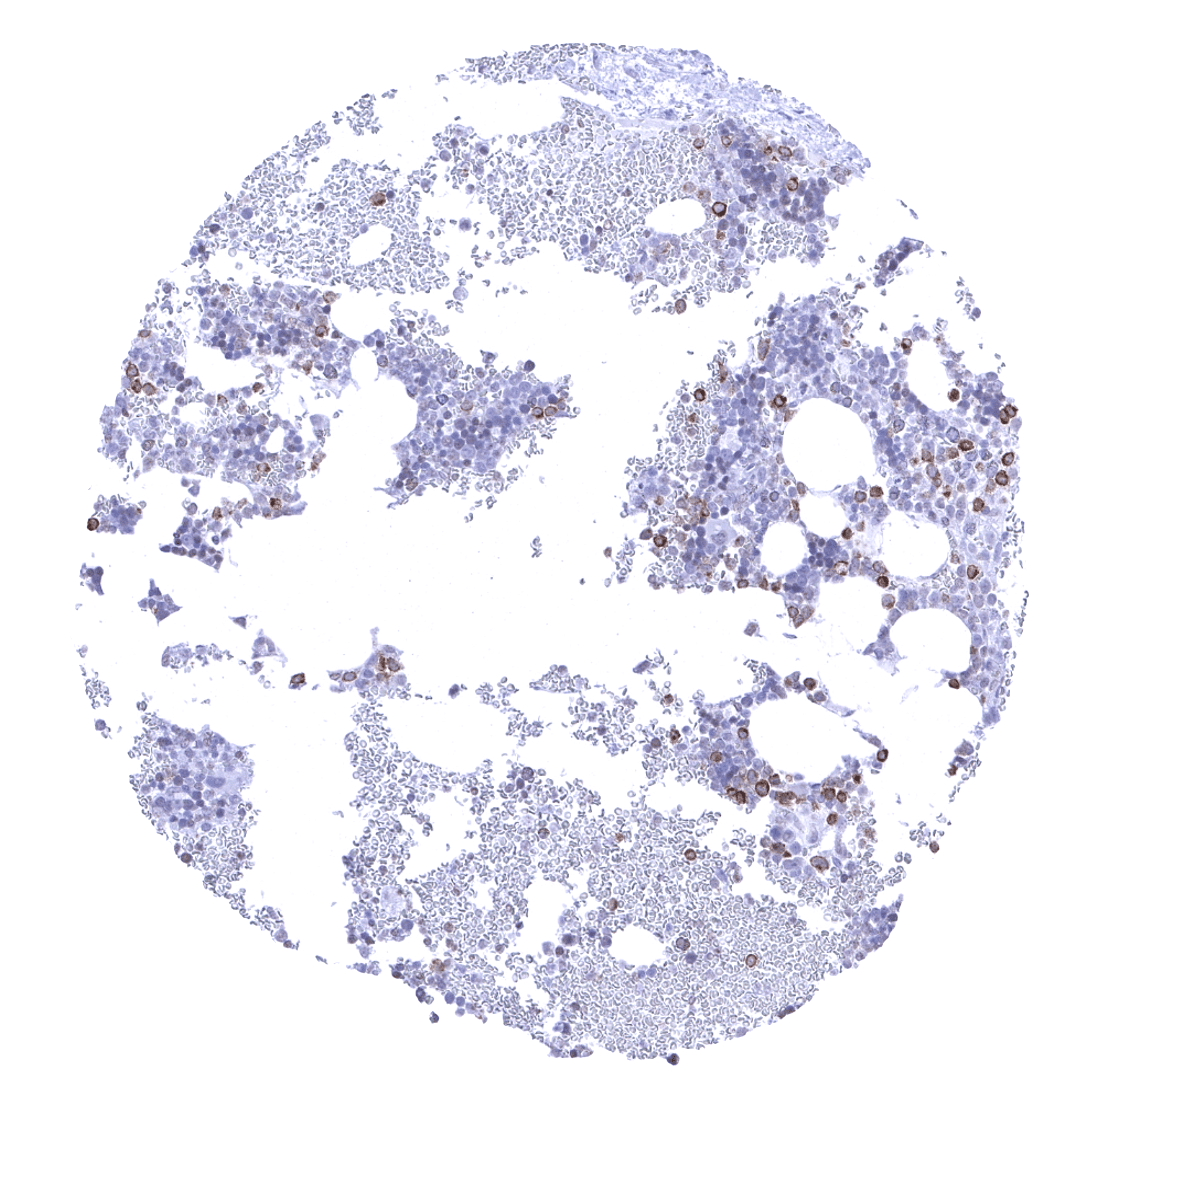
| Bone marrow/ lymphoid tissue | Bone marrow | A small fraction of cells is Trop-2 positive (granulocytes?) |
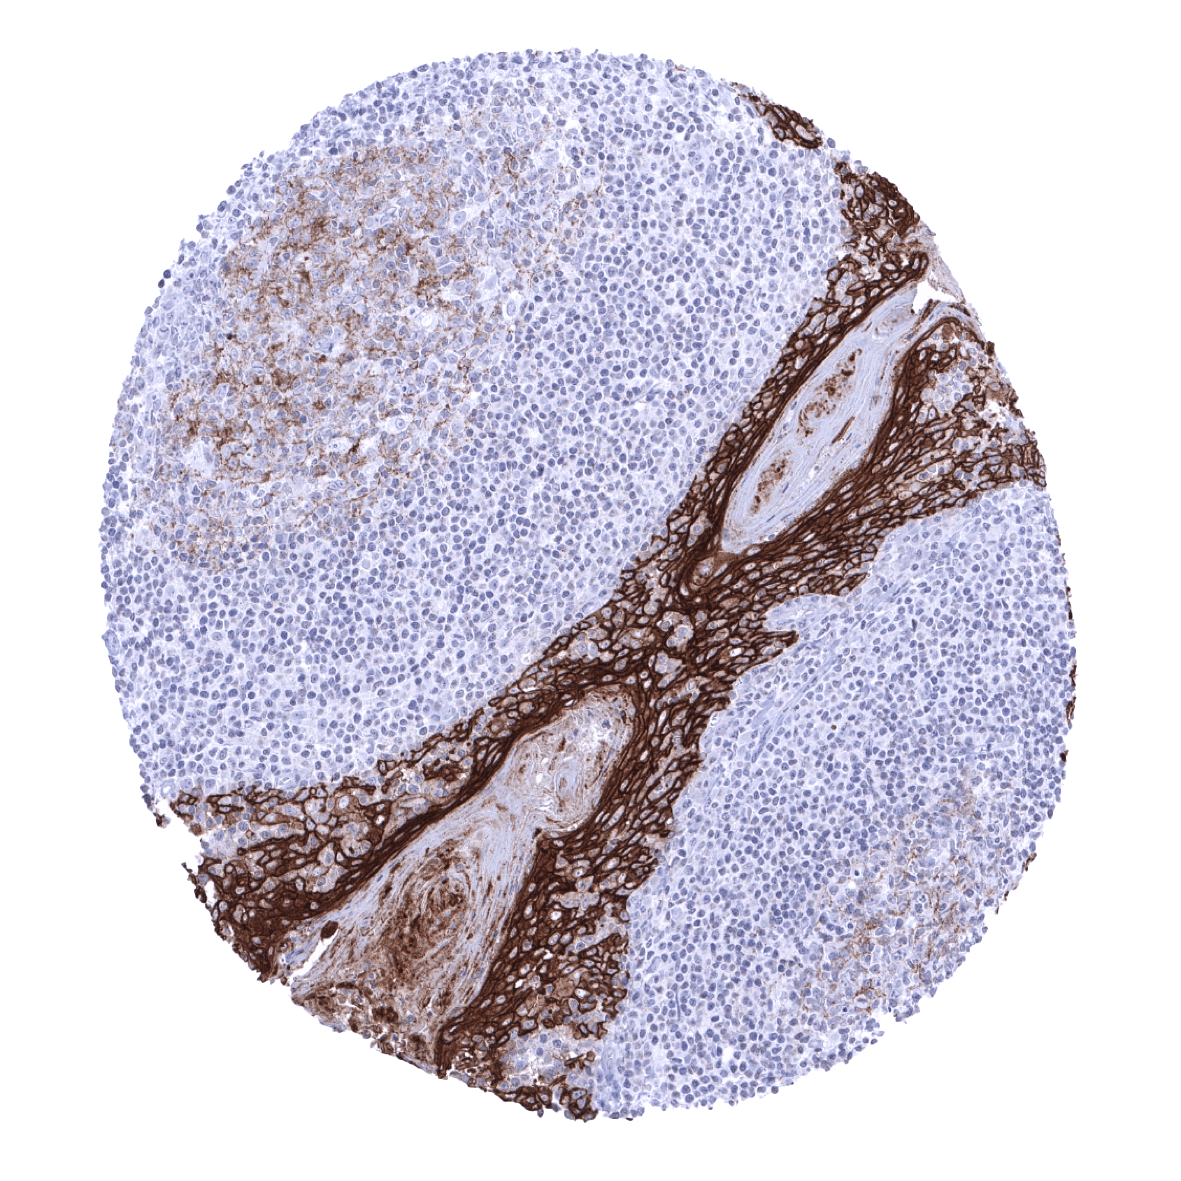
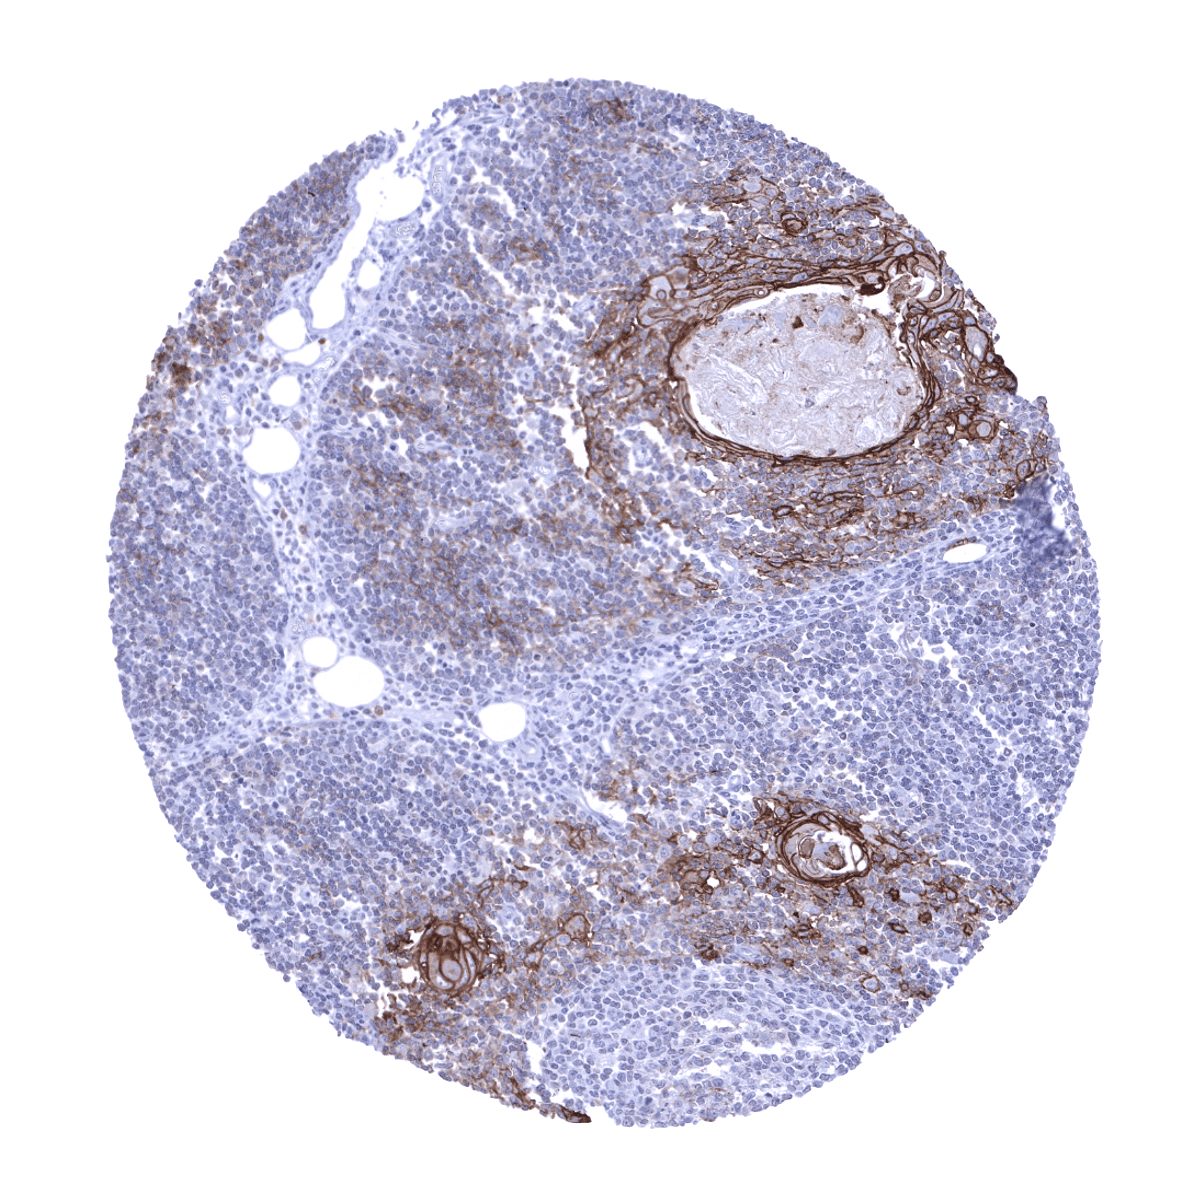
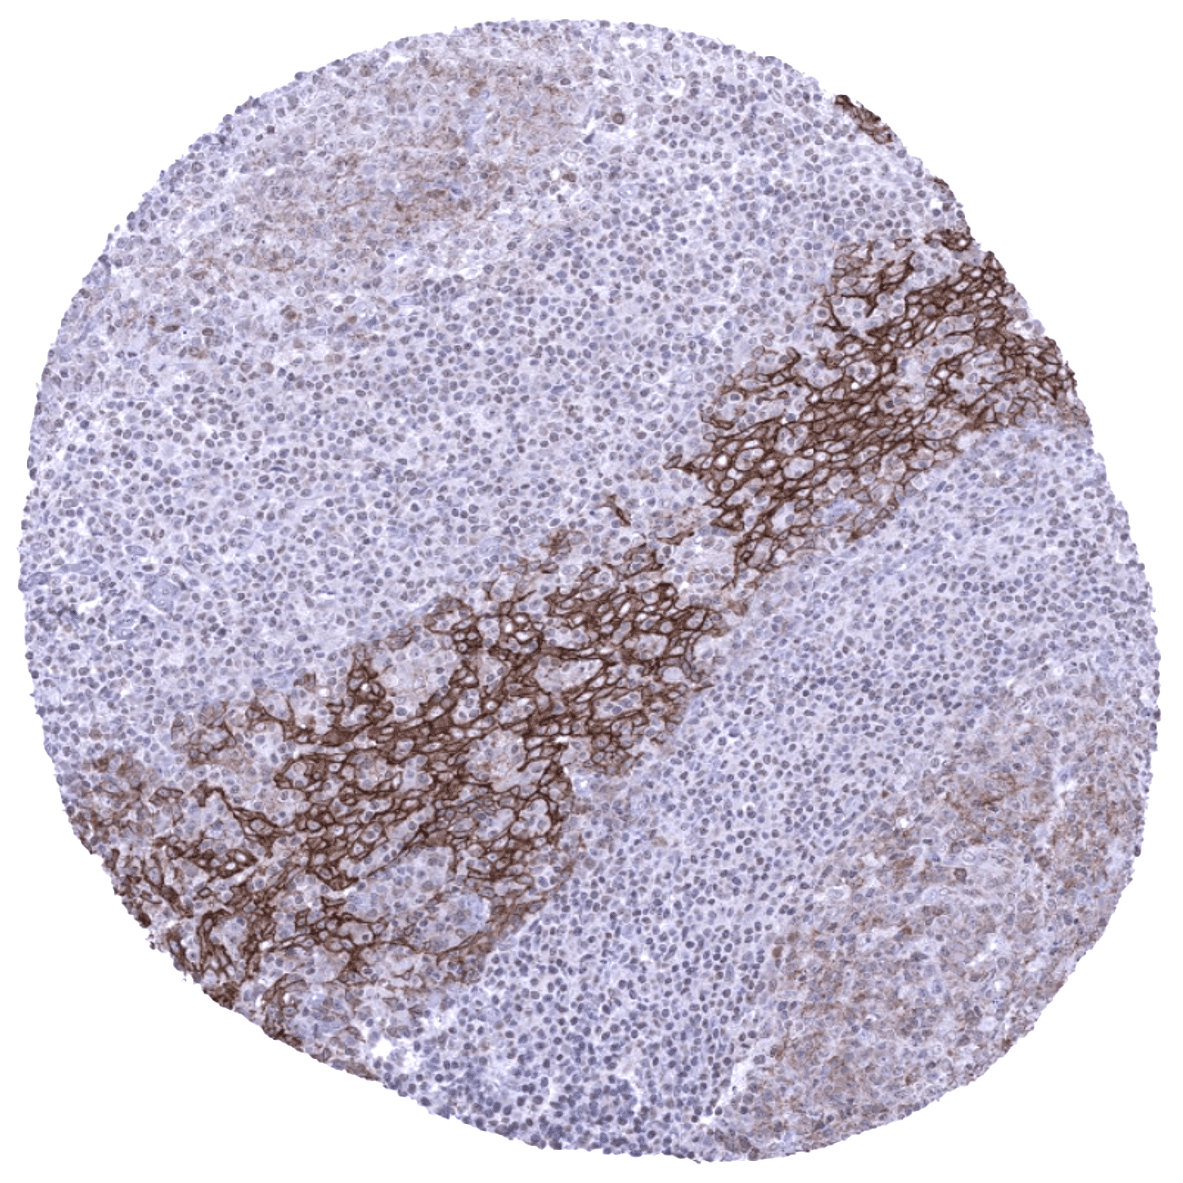
| Lymph node | Weak Trop-2 staining of a fraction of germinal centre cells. | |
| Spleen | Negative. | |
| Thymus | Strong Trop-2 staining of all epithelial cells and of corpuscles of Hassall’s. | |
| Tonsil | Strong Trop-2 staining of all squamous epithelial cells. Weak Trop-2 staining of a fraction of germinal centre cells. | |
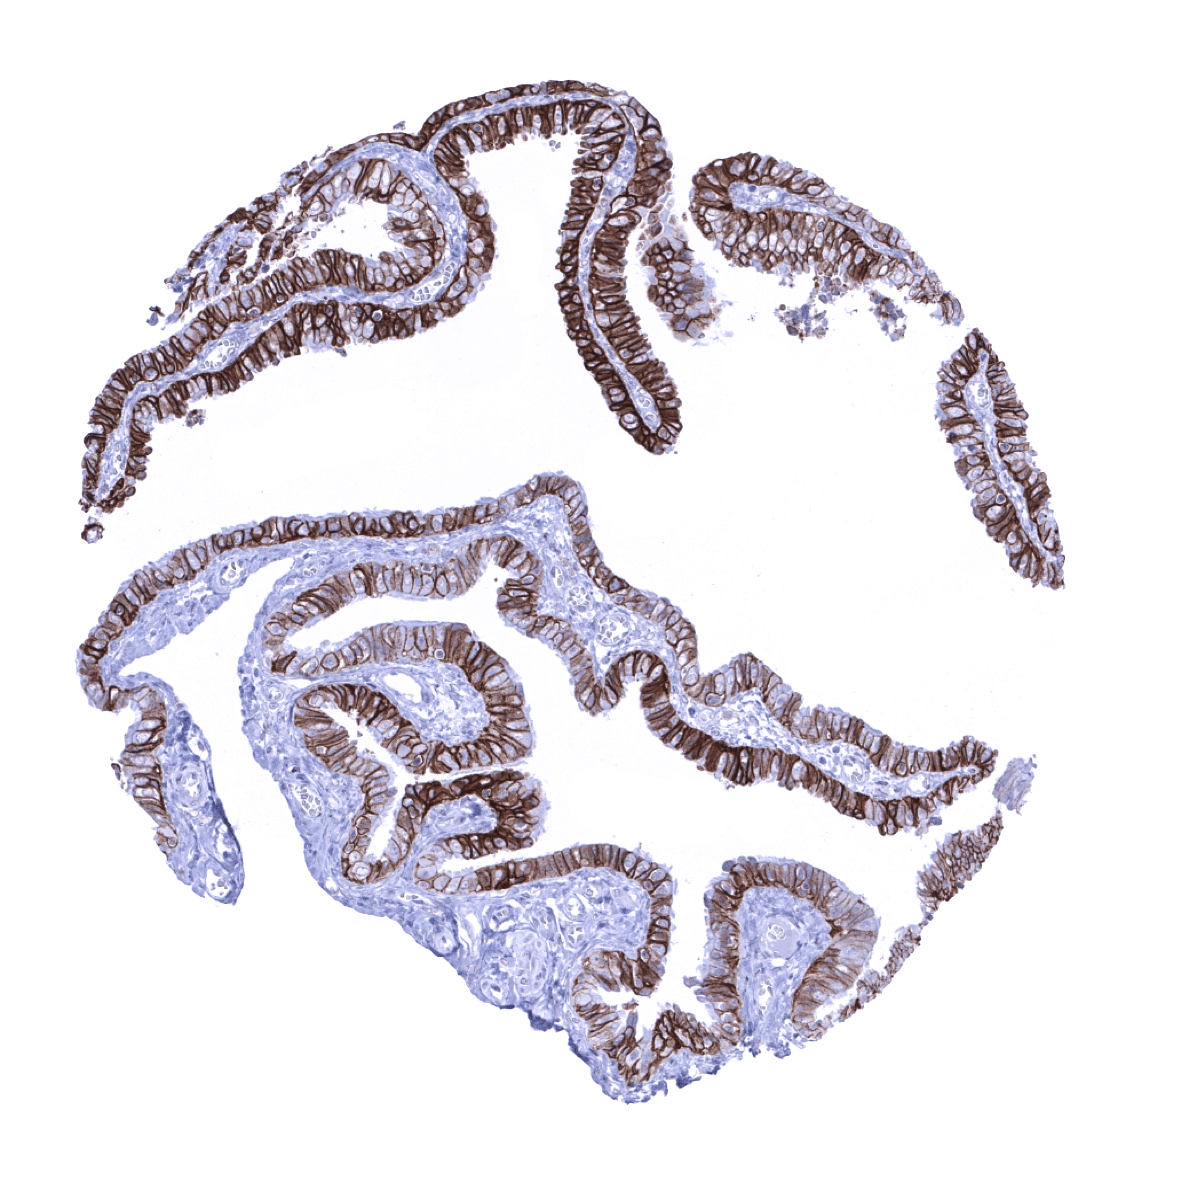
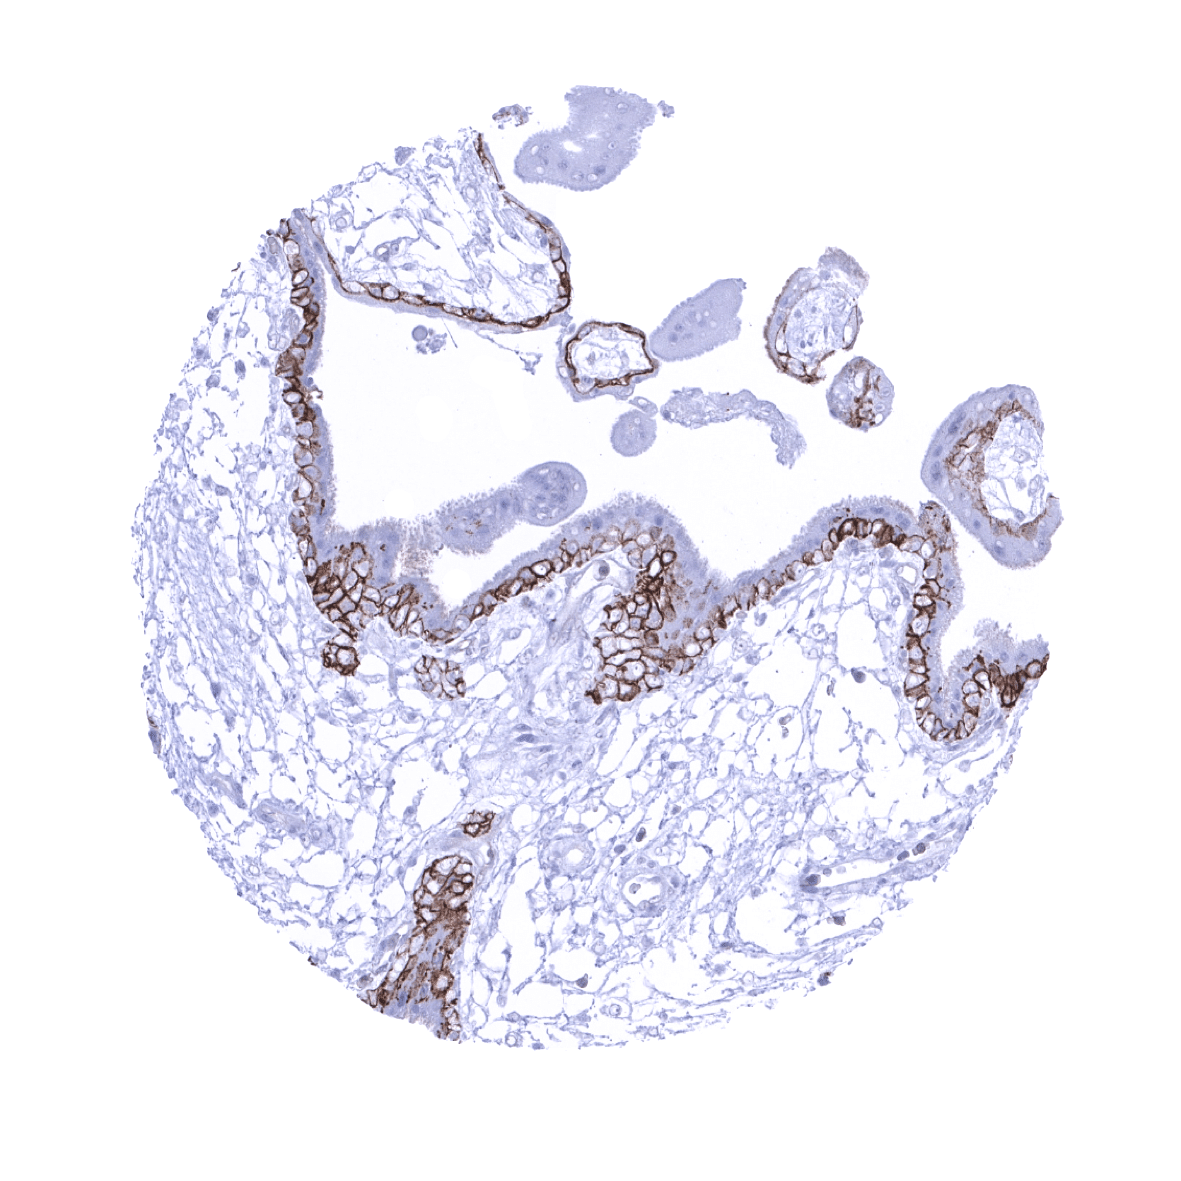
| Remarks | Trop-2 staining is predominantly membranous. |
These findings are largely consistent with the RNA and protein data described in the Human Protein Atlas (Tissue expression TACSTD2)
Positive control: Liver: A strong membranous Trop-2 immunostaining should be seen in bile ducts.
Negative control: Liver: Hepatocytes should not show any Trop-2 immunostaining.


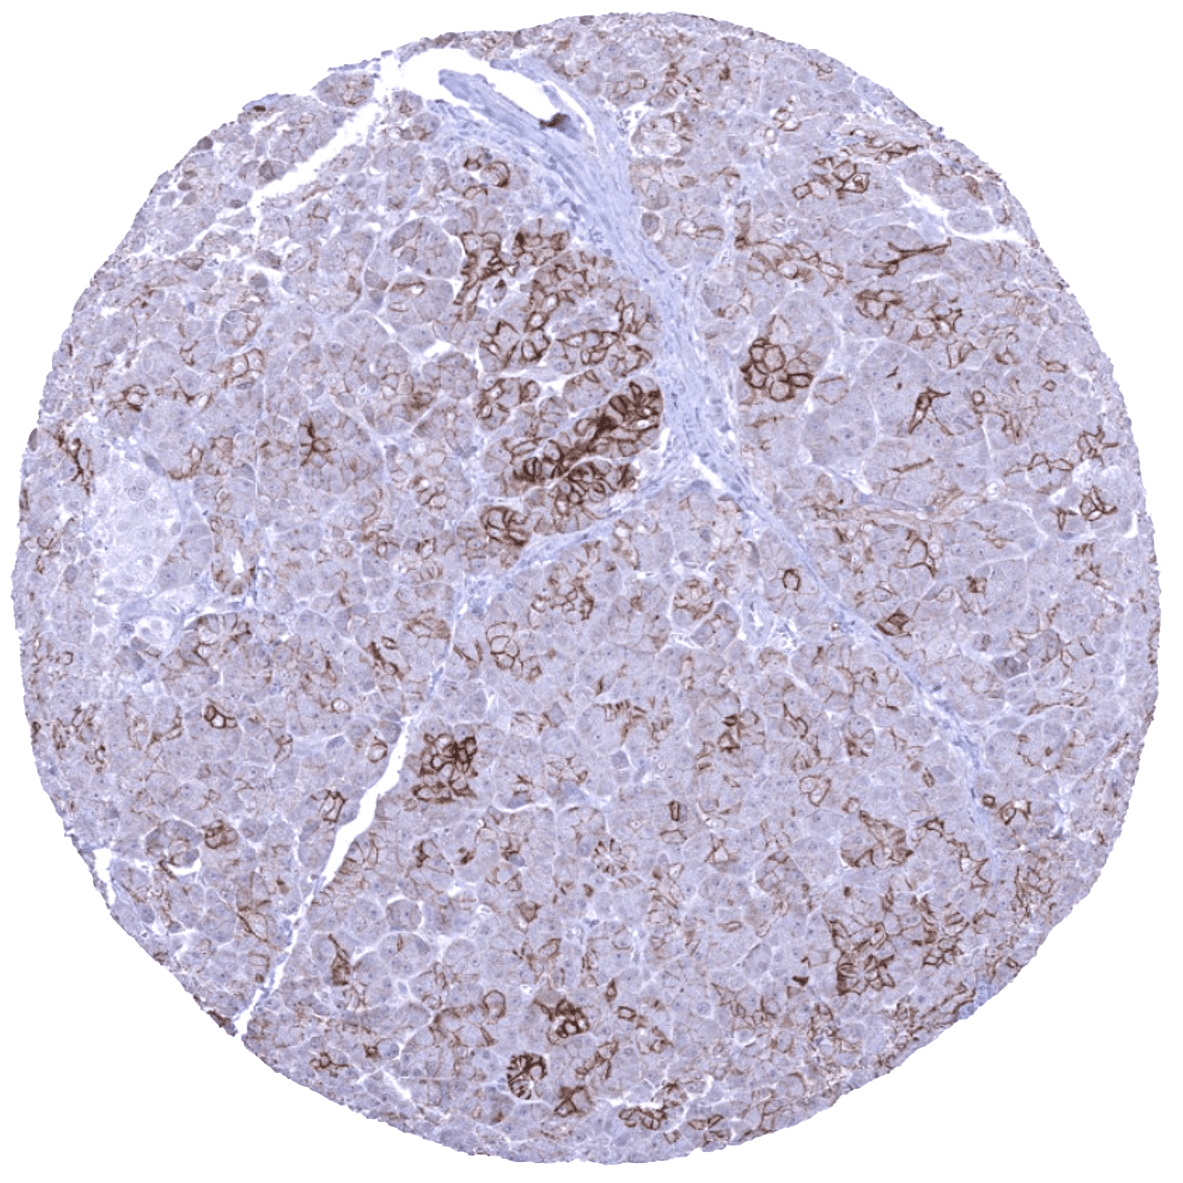
Staining Pattern in Relevant Tumor Types
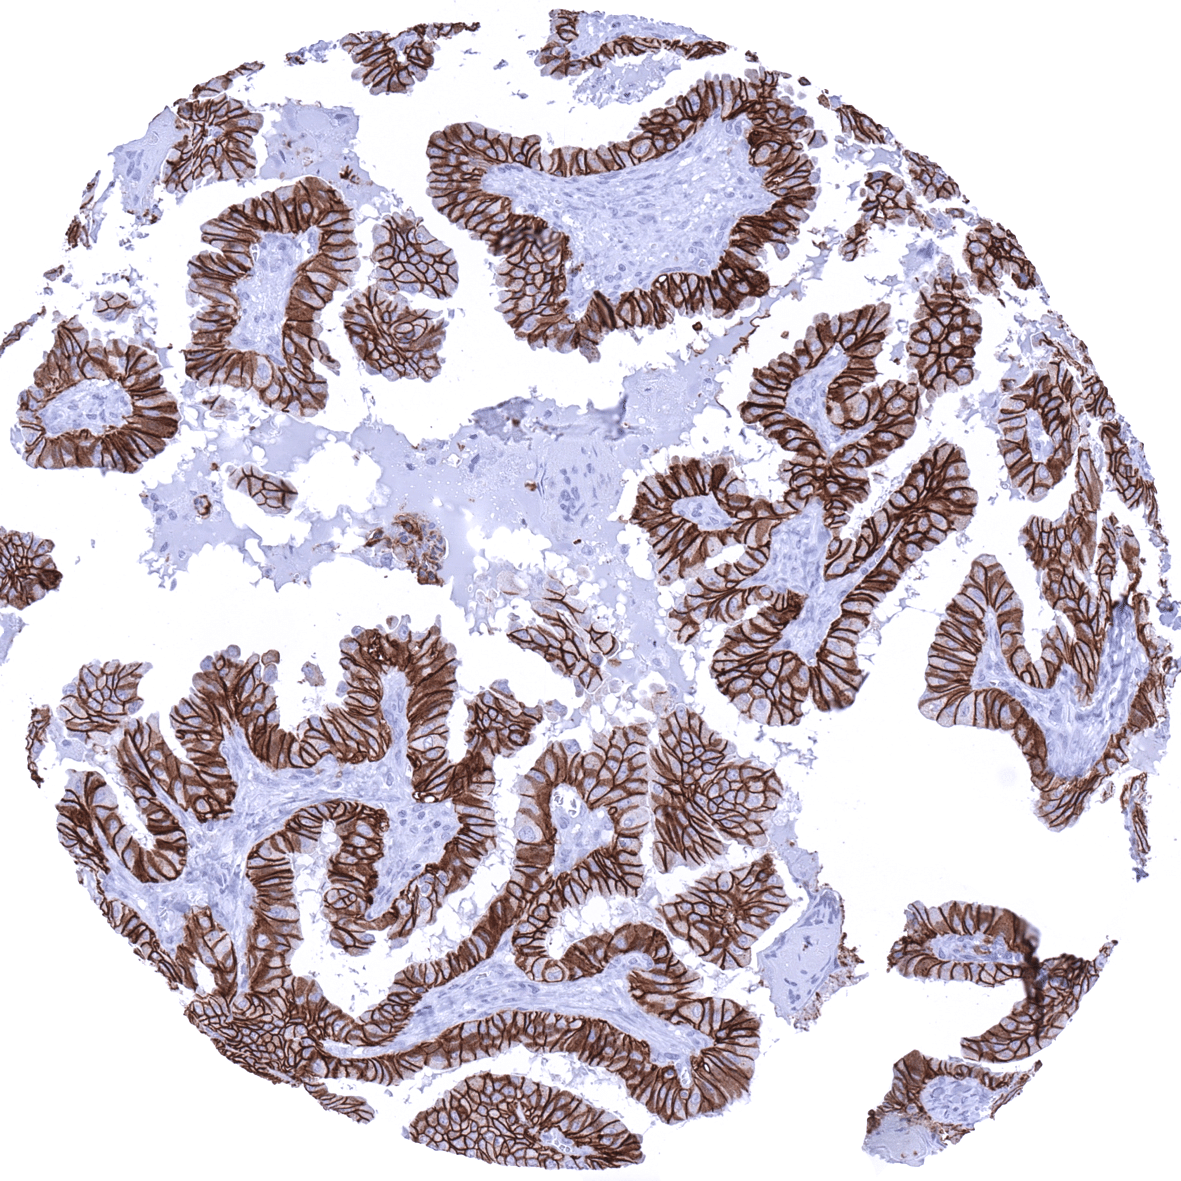
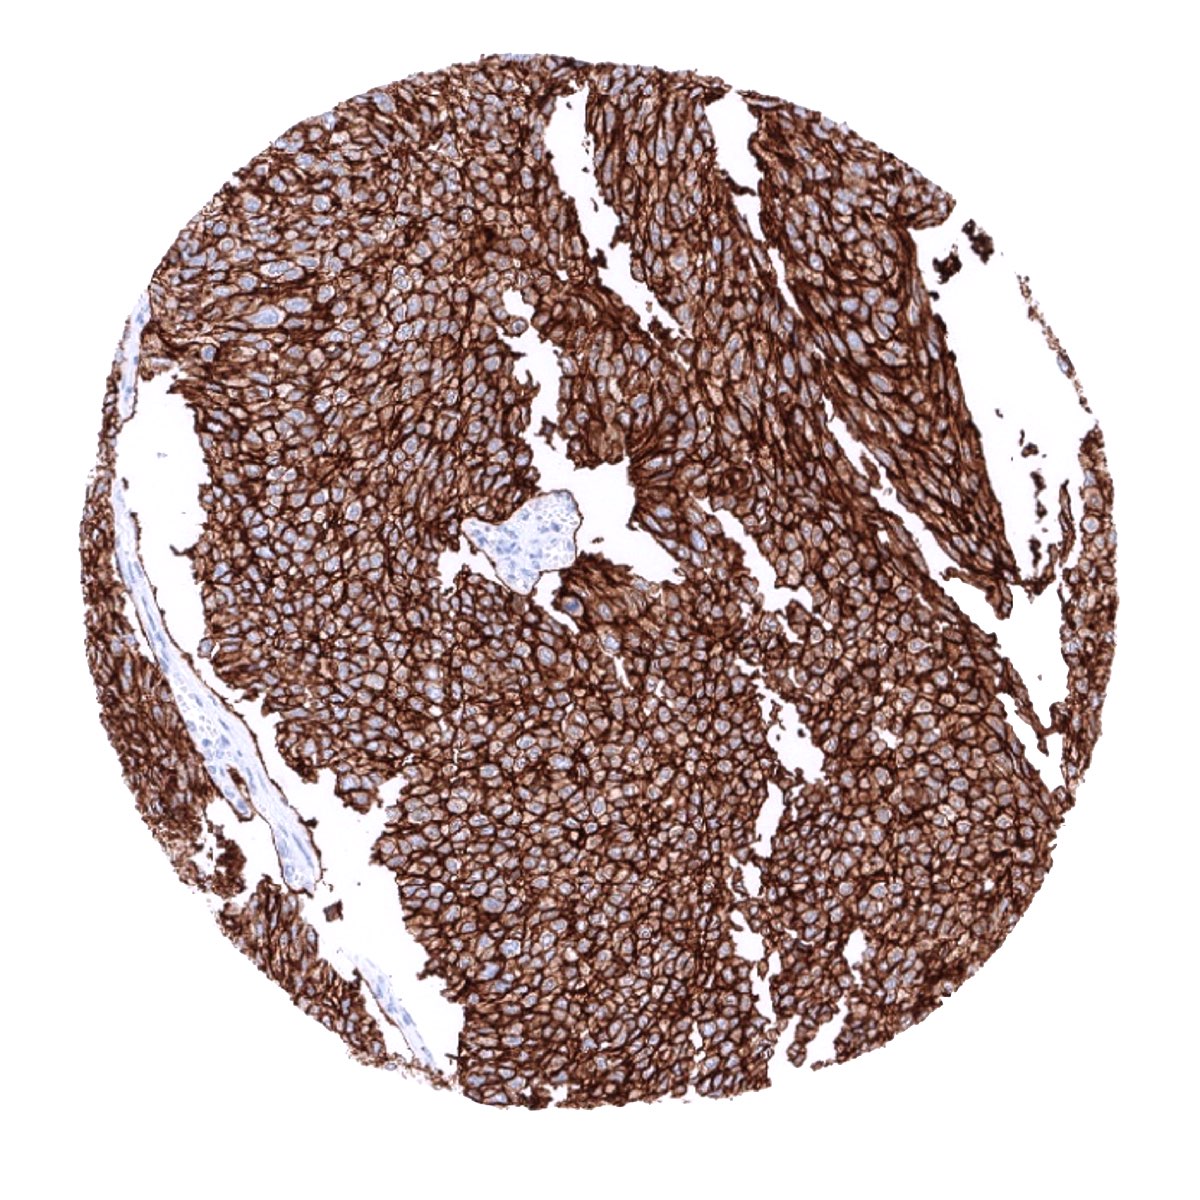
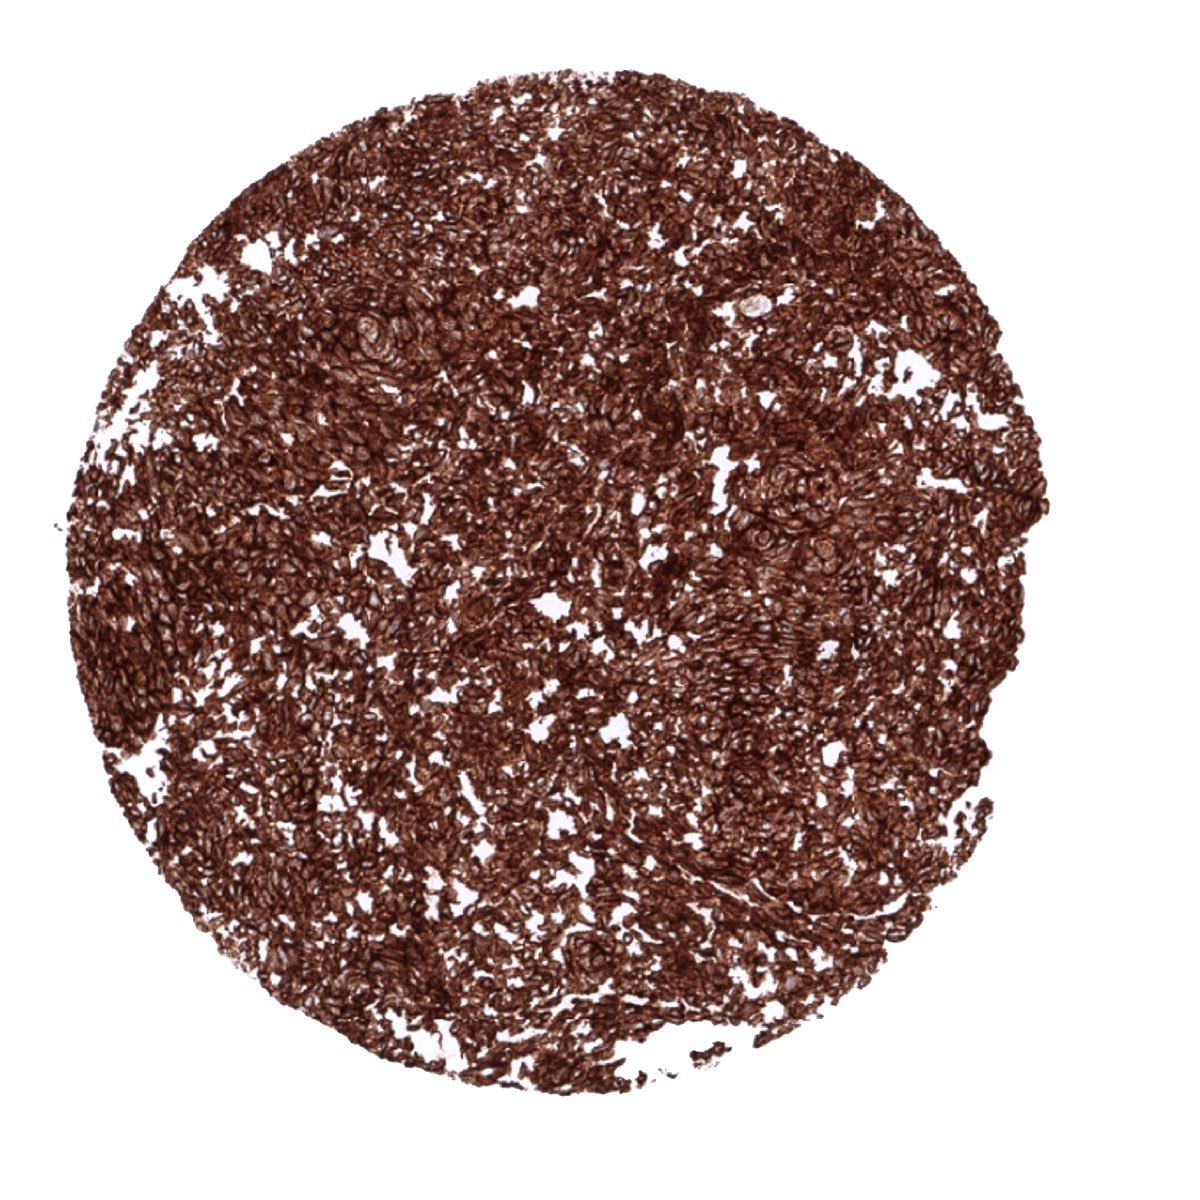
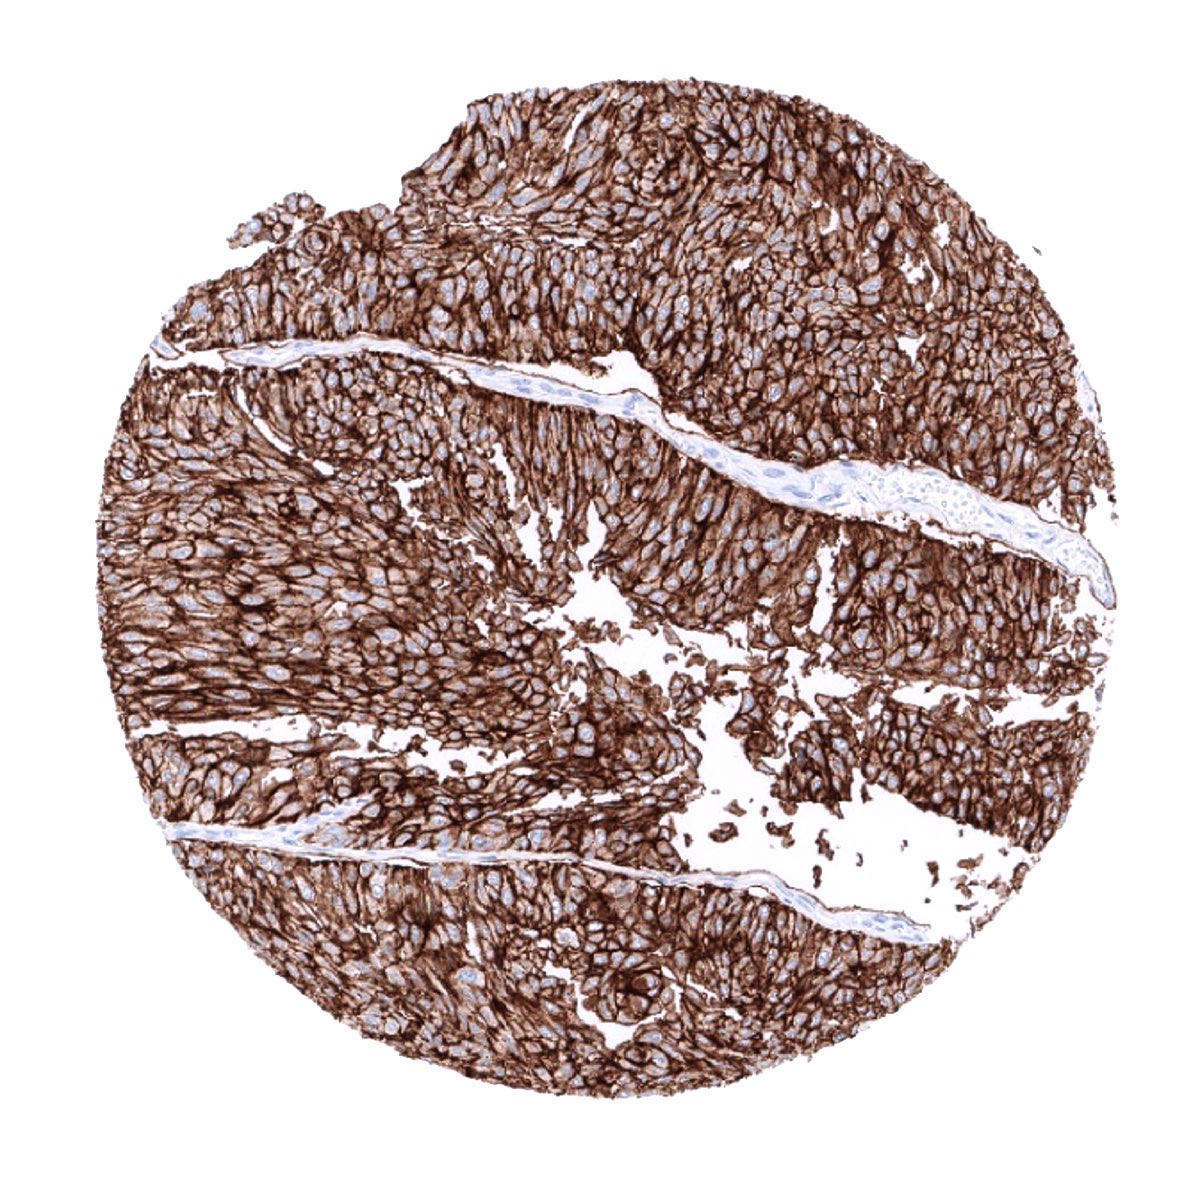
A positive Trop-2 immunostaining of variable intensity can be seen in a broad range of different tumor entities which are mostly derived from Trop-2 positive normal cell types.
The TCGA findings on TACSTD2 RNA expression in different tumor categories have been summarized in the Human Protein Atlas.
Compatibility of Antibodies
TROP2 (MSVA-733R) publication summary
Relevant publication: Dum et al.: “Trophoblast cell surface antigen 2 (TROP2) expression in human tumors: A tissue microarray study on 18,563 tumors.” Published in Pathobiology. 2022 Apr 27:1-14. PMID: 35477165.
A total of 16,024 tumors from 150 different tumor categories were successfully analyzed for TROP2 by using the following protocol: Heat-induced antigen retrieval for 5 minutes in an autoclave at 121°C in pH 7,8 Target Retrieval Solution buffer. MSVA-733R at a dilution of 1:150 at 37°C for 60 minutes. Visualization of bound antibody by the EnVision Kit (Dako, Agilent). This protocol was also used for all TROP2 immunostainings depicted in our tumor and normal tissue galleries.
At least one case with a positive TROP2 immunostaining was seen in 109 (72.6%) and at least one case with a strong TROP2 immunostaining was seen in 89 (59.3%) of 150 tumor categories. The distribution of positive staining results is shown in an “organ-systematic” (Figure 1) and in a “ranking order” figure (Figure 2) below (images based on data from Dum et al). Data on associations with histopathological and clinical parameters of tumor aggressiveness in several cancer types are also summarized below (Figure 3; based on data described by Dum et al).
Authors conclusions on diagnostic utility with respect to the distinction of benign versus malignant (Dum et al):
- Not applicable
Authors conclusions on diagnostic utility with respect to the distinction of different tumor entities (Dum et al):
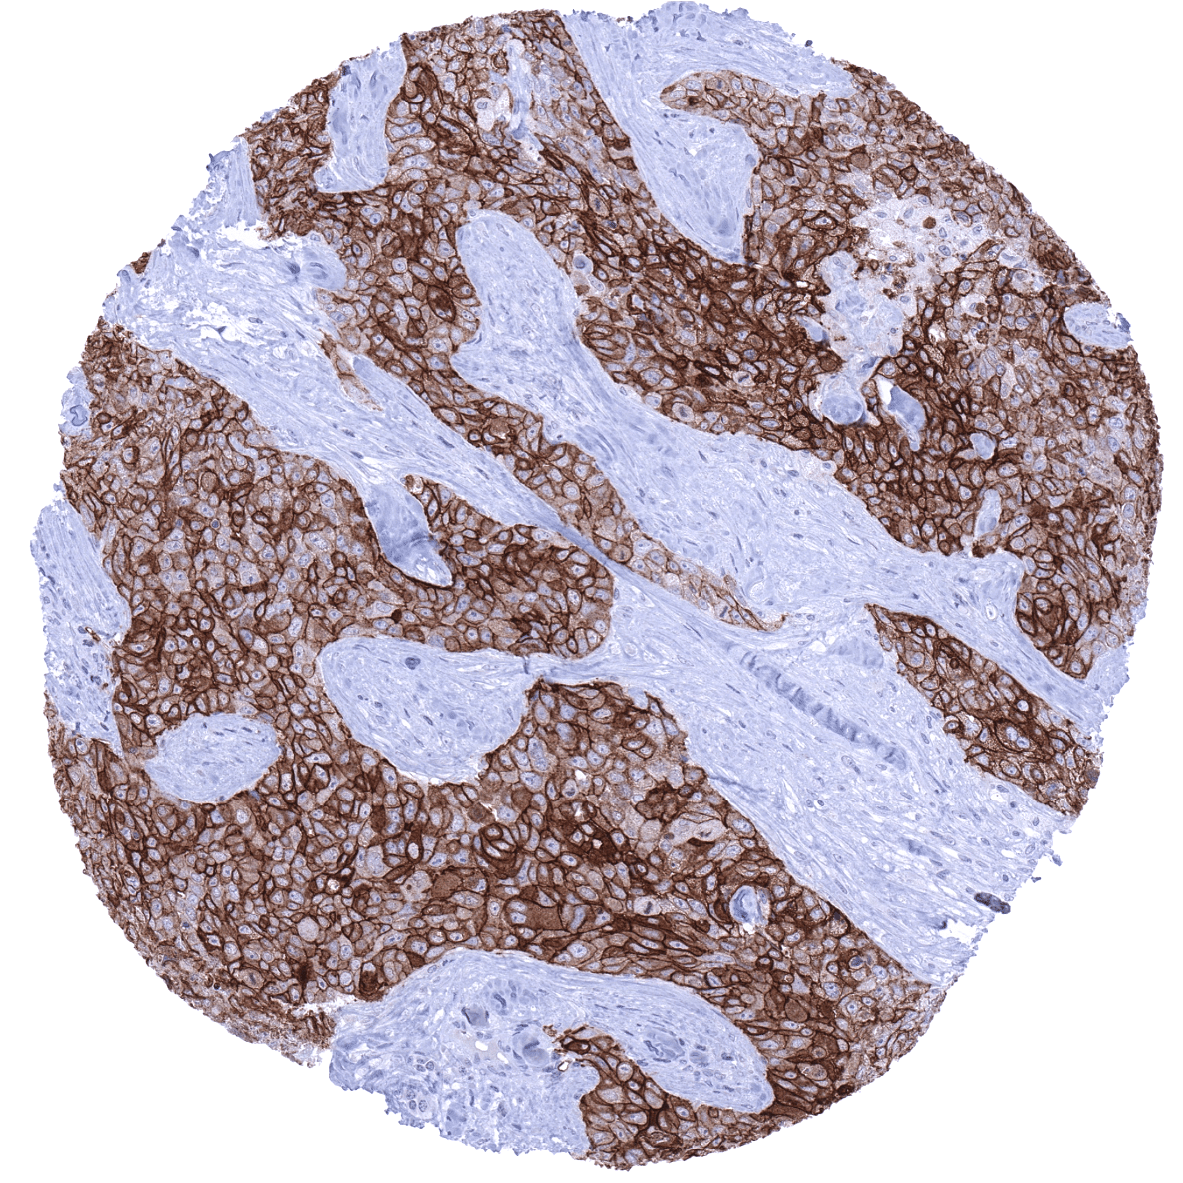
- Based on the marked difference in TROP2 positivity between epitheloid mesothelioma (16.1% positive; 3,2% moderate to strong) and adenocarcinomas of the lung (93.9% positive; 89,5% moderate to strong), TROP2 immunohistochemistry could be of use for the distinction of these tumor entities.
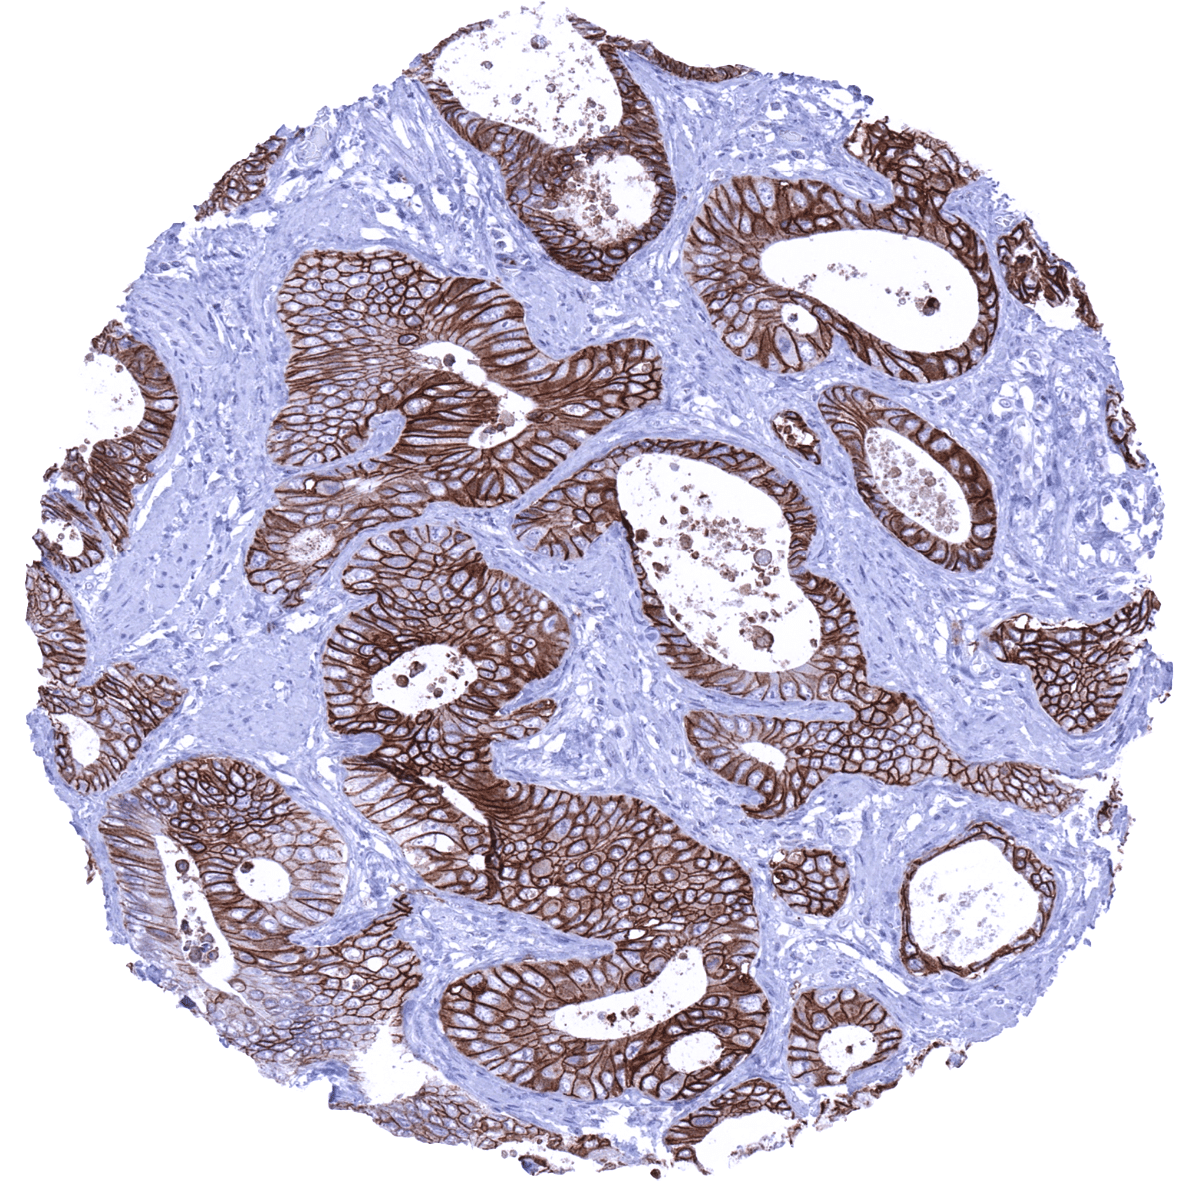
- A low or absent TROP2 expression in an “intestinal type” adenocarcinoma could favor the diagnosis of colorectal adenocarcinoma (negative or weak TROP2 expression in 84.8%) as morphologically similar tumors such as ductal adenocarcinomas of the pancreas (7% negative/weak), adenocarcinomas of the gall bladder (17.2% negative/weak), and even gastric carcinomas (45-50% negative/weak) typically show higher TROP2 expression levels.
- A high TROP2 expression may favor a diagnosis of papillary carcinoma (58,3% strong; 16% negative) over follicular carcinoma (5,3% strong; 62,7% negative) of the thyroid.
Authors conclusions on prognostic/predictive role of TROP2 expression (Dum et al.):
- High TROP2 expression levels with advanced stage, nodal metastasis, L1-, and V1 status in colorectal carcinomas (High TROP2 expression in these cancers is aberrant because these tumors are derived from TROP2 negative precursor cells) and with nodal metastasis in papillary thyroid cancers.
- Low TROP2 expression was linked to unfavorable features in breast cancer of no special type (NST), renal cell carcinoma, and in urothelial carcinoma (Low TROP2 expression in these cancers is aberrant because these tumors are derived from TROP2 positive precursor cells).
Data from the publication: “Trophoblast cell surface antigen 2 (TROP2) expression in human tumors: A tissue microarray study on 18,563 tumors.” Published by Dum et al. in Pathobiology. 2022 Apr 27:1-14. PMID: 35477165.
Figure 1. TROP2 staining in cancer (“organ-systematic”; according to Dum et al.)
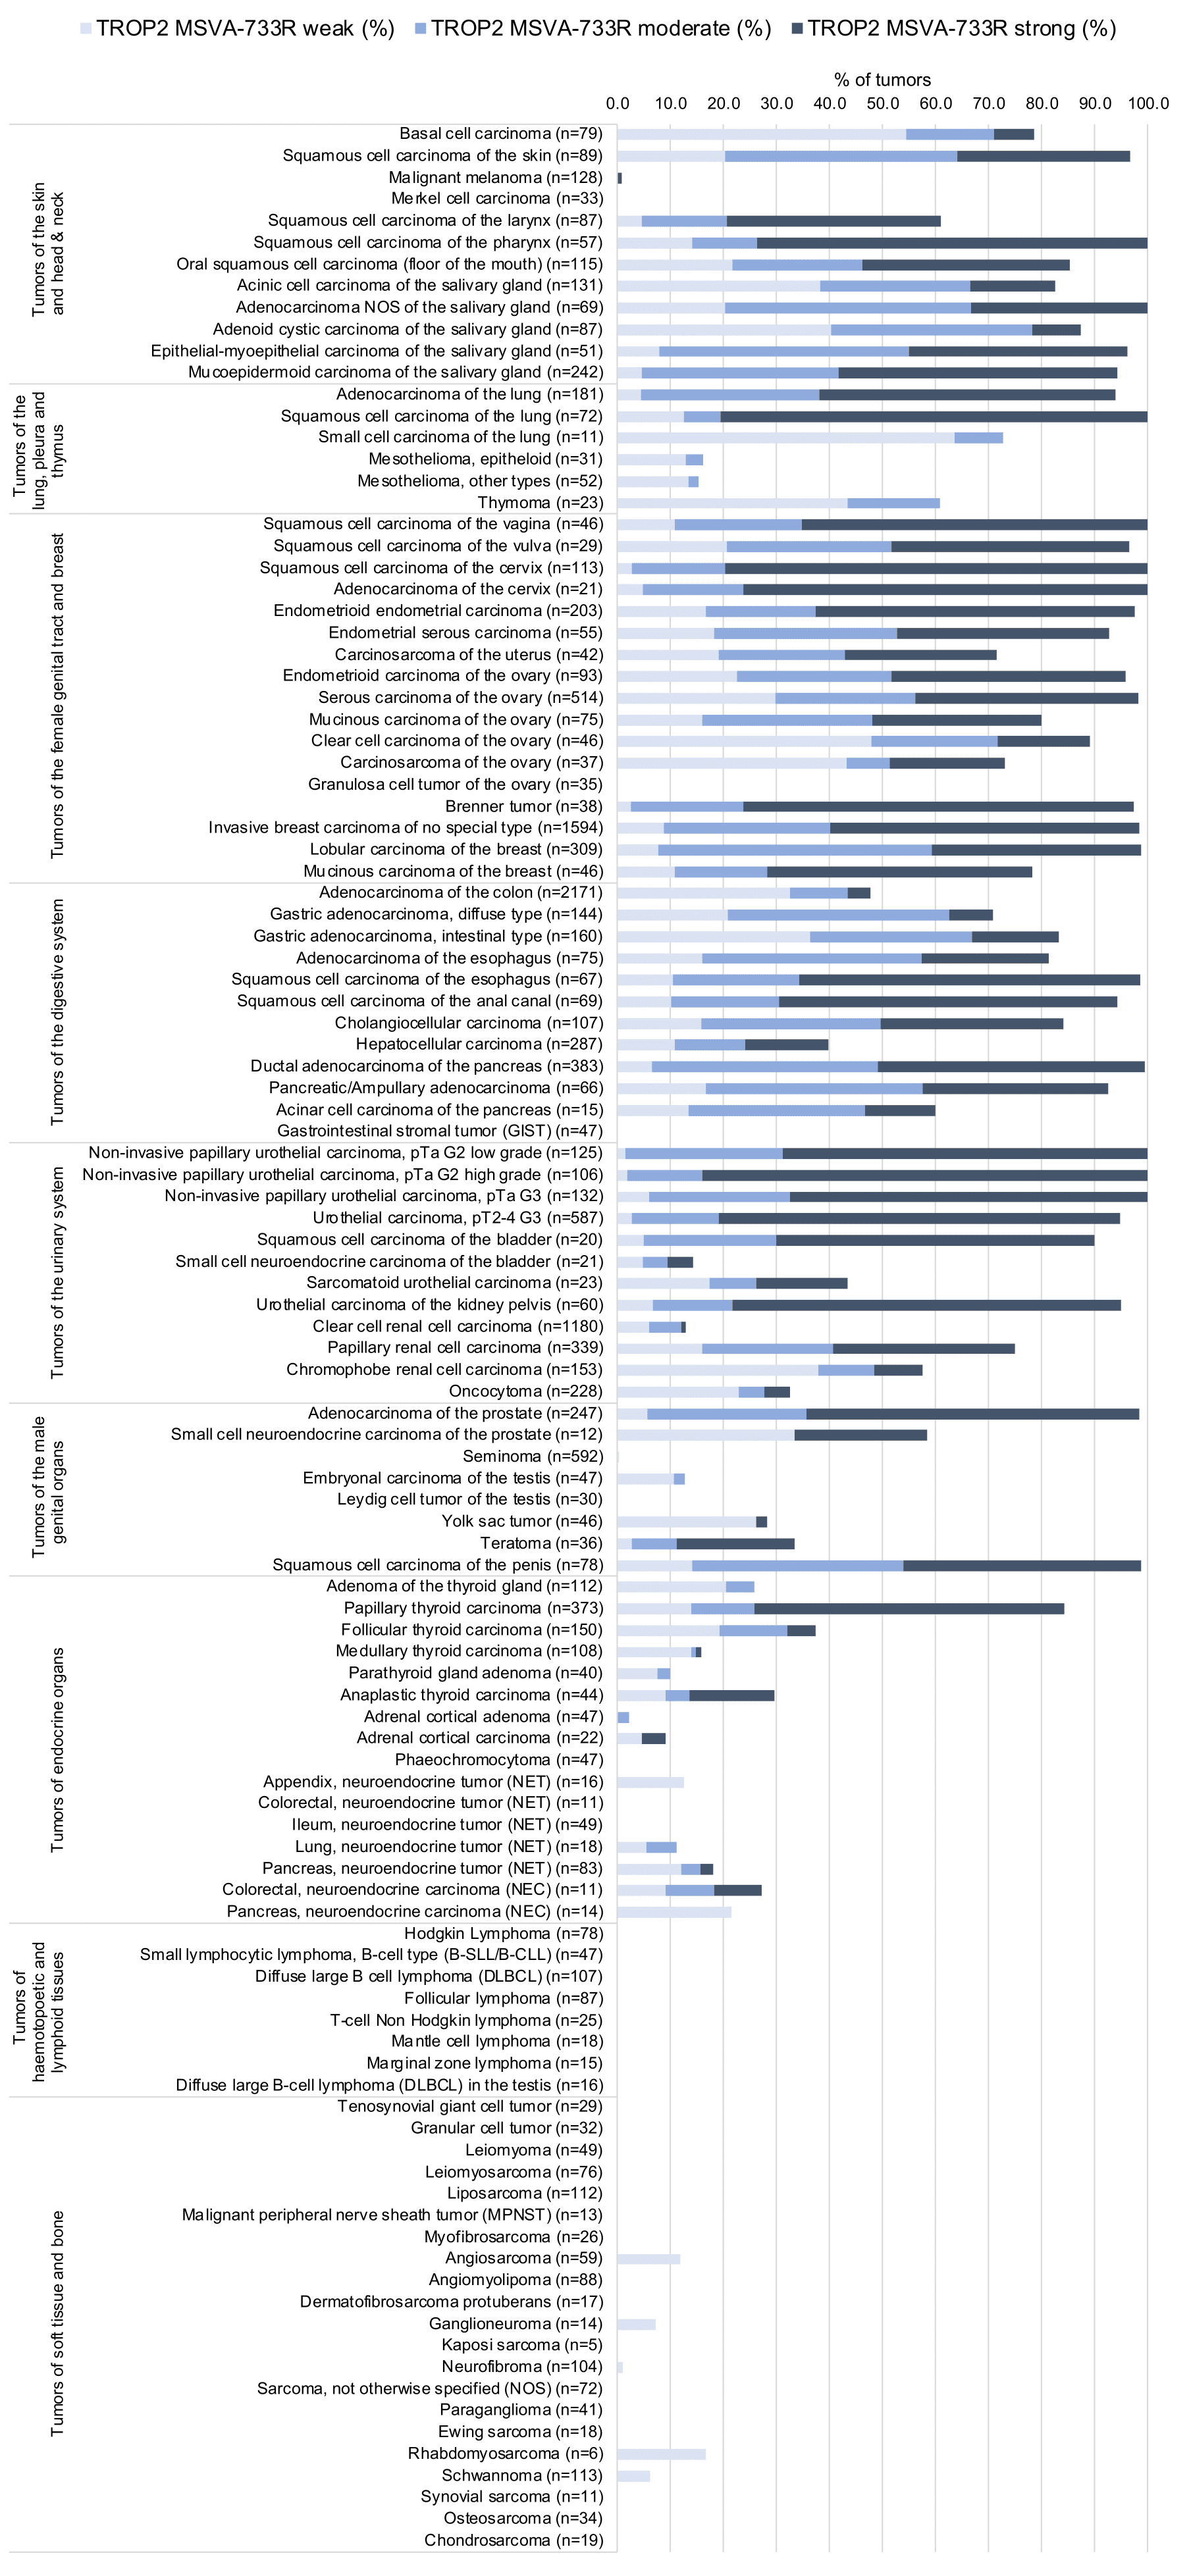
Figure 2. TROP2 staining in cancer (“ranking list”; according to Dum et al.)
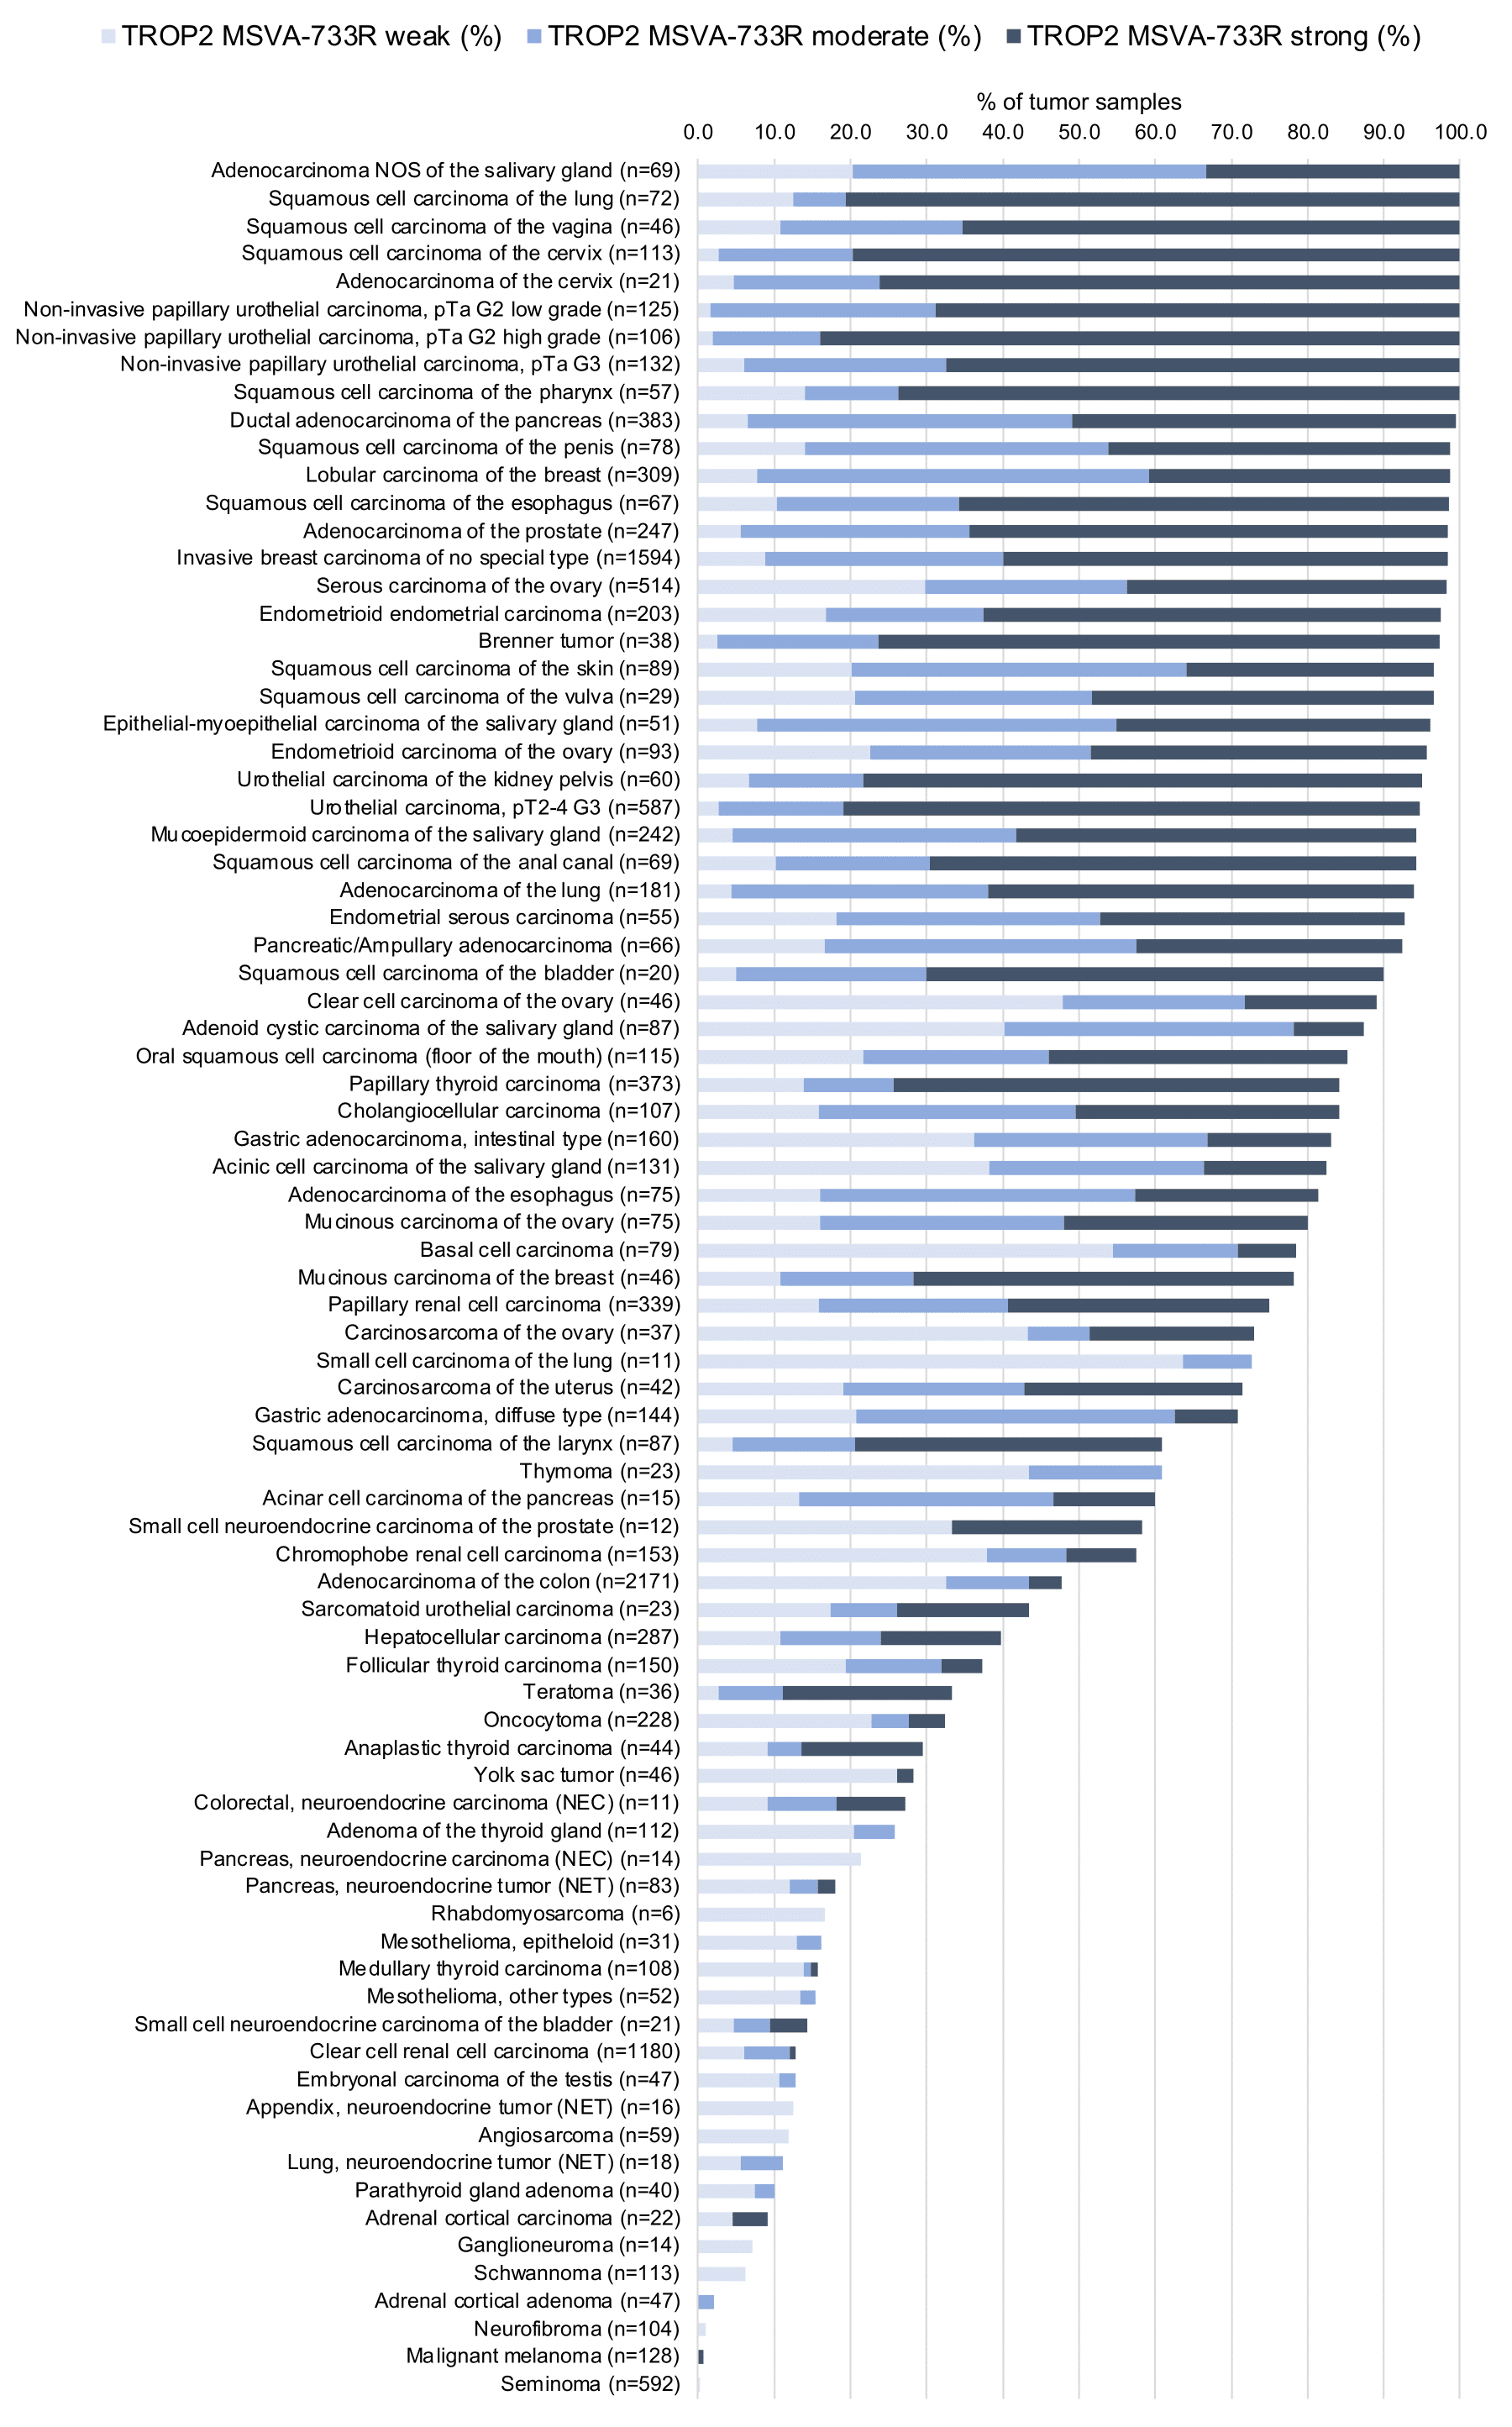
Figure 3. TROP2 staining and tumor phenotype (according to Dum et al.)
Protocol Recommendations
IHC users have different preferences on how the stains should look like. Some prefer high staining intensity of the target stain and even accept some background. Others favor absolute specificity and lighter target stains. Factors that invariably lead to more intense staining include higher concentration of the antibody and visualization tools, longer incubation time, higher temperature during incubation, higher temperature and longer duration of the heat induced epitope retrieval (slide pretreatment). The impact of the pH during slide pretreatment has variable effects and depends on the antibody and the target protein.
All images and data shown here and in our image galleries are obtained by the manual protocol described below. Other protocols resulting in equivalent staining are described as well.
Manual protocol
Freshly cut sections should be used (less than 10 days between cutting and staining). Heat-induced antigen retrieval for 5 minutes in an autoclave at 121°C in pH 7,8 Target Retrieval Solution buffer. Apply MSVA-733R at a dilution of 1:150 at 37°C for 60 minutes. Visualization of bound antibody by the EnVision Kit (Dako, Agilent) according to the manufacturer’s directions.
Agilent / Dako – Autostainer Link 48
Pretreatment in PT-Link for 30 minutes at 95°C (pH high); FLEX peroxidase blocking for 5 minutes (room temperature), MSVA-733R 1:100 for 20 minutes (room temperature), FLEX+ mouse/rabbit (LINKER) for 15 minutes (room temperature), horseradish peroxidase (HRP) for 20 minutes (room temperature), FLEX DAB+Sub-Chromo for 10 minutes (room temperature), FLEX hematoxylin for 5 minutes (room temperature).

These images reflect stainings by the protocol described above. It is of note that a comparable staining result can also be obtained by different protocols. In general, a longer pretreatment, a longer incubation time of the primary antibody, a higher antibody concentration, and a longer incubation time of FLEX+LINKER result in stronger staining, potentially at the cost of more background staining. Modifications of the protocol with a strengthening effect on staining intensity in combination with changes of other parameters that result in lower staining intensity can result in a comparable result as shown above.
Leica – BOND RX
Dewax at 72°C for 30 seconds; Pretreatment in Bond Epitope Retrieval Solution (ER2 – EDTA pH9) for 20 minutes at 100°C; Peroxidase blocking for 5 minutes (room temperature), MSVA-733R 1:100 for 15 minutes (room temperature), Post primary (rabbit anti mouse) for 8 minutes (room temperature), Polymer (goat anti rabbit) for 8 minutes (room temperature), mixed DAB refine for 10 minutes (room temperature), hematoxylin for 5 minutes (room temperature).


These images reflect stainings by the protocol described above. It is of note that a comparable staining result can also be obtained by different protocols. In general, a longer pretreatment, a longer incubation time of the primary antibody, a higher antibody concentration, a higher temperature during incubation, and a longer incubation time of Post primary and or the Polymer result in stronger staining, potentially at the cost of more background staining. Modifications of the protocol with a strengthening effect on staining intensity in combination with changes of other parameters that result in lower staining intensity can result in a comparable result as shown above.
Roche – Ventana Discovery ULTRA
Pretreatment for 64 minutes at 100°C (pH 8,4); CM peroxidase blocking for 12 minutes (room temperature), MSVA-733R 1:100 for 20 minutes at 36°C, secondary antibody (anti-rabbit HQ) for 12 minutes at 36°C, anti-HQ HRP for 12 minutes at room temperature, DAB at room temperature, hematoxylin II at room temperature for 8 minutes, bluing reagent at room temperature for 4 minutes.
These images depict staining results obtained by the protocol described above. It is of note, that the Ventana machines generally require higher antibody concentrations than other commonly used autostainers because the antibodies are automatically diluted during the procedure. Various other protocols can result in an identical result as shown above. A longer pretreatment, a longer incubation time of the primary antibody, a higher antibody concentration, a higher temperature during incubation, and a longer incubation time of secondary antibody and or the anti-HQ HRP result in stronger staining, potentially at the cost of more background staining.
Potential Research Applications
- The predictive and prognostic role of Trop-2 expression in cancer requires further evaluation.
-
It is currently unclear whether the extent of Trop-2 expression in tumor cells predicts a response to anti-Top-2 drugs.
- The prevalence of Trop-2 overexpression is unclear for many tumor entities.
Evidence for Antibody Specificity in IHC
There are only two methods for documentation of antibody specificity for immunohistochemistry on formalin fixed tissues. These are: 1. comparison with a second independent method for target expression measurement across a large number of different tissue types (orthogonal strategy), and 2. Comparison with one or several independent antibodies for the same target and showing that all positive staining results are also seen with other antibodies for the same target (independent antibody strategy). Both of these methods were applied for validation of MSVA-733R.
Orthogonal validation: For this validation method, RNA expression data from public datasets which all summarized in the Human Protein Atlas (Tissue expression TACSTD2)were used. These RNA data describe Trop-2 expression in all organs containing squamous epithelium as well as several other organs as Trop-2 positive. Immunostaining by using MSVA-733R was detected in the organs with documented Trop-2 RNA expression but also a series of tissues without documented RNA expression or with very low RNA expression levels. These findings can only be validated by using a second independent antibody.
Comparison of antibodies: True Trop-2 protein expression of specialized cell types in organs without documented Trop-2 RNA (thymus, bronchus, placenta, stomach, intestine, gallbladder, liver, fallopian tube, uterus, thyroid, and pituitary gland) was confirmed by the independent second antibody approach (images shown below). A comparative staining with another independent, commercially available antibody (referred as “XX”) confirms the occurrence of Trop-2 positive cell populations in these tissues (images are shown below).
Antibody Comparison: MSVA-733R vs another commercial anti-TACSTD2 antibody called “XX”


