
295,00 € – 1.145,00 €
Product details
Synonyms = B7 homolog 1; B7-H1; CD274; PD-L1; PDCD1 ligand 1; PDCD1L1; PDCD1LG1; Programmed cell death 1 ligand 1
Antibody type = Recombinant Rabbit monoclonal / IgG
Clone = MSVA-711R
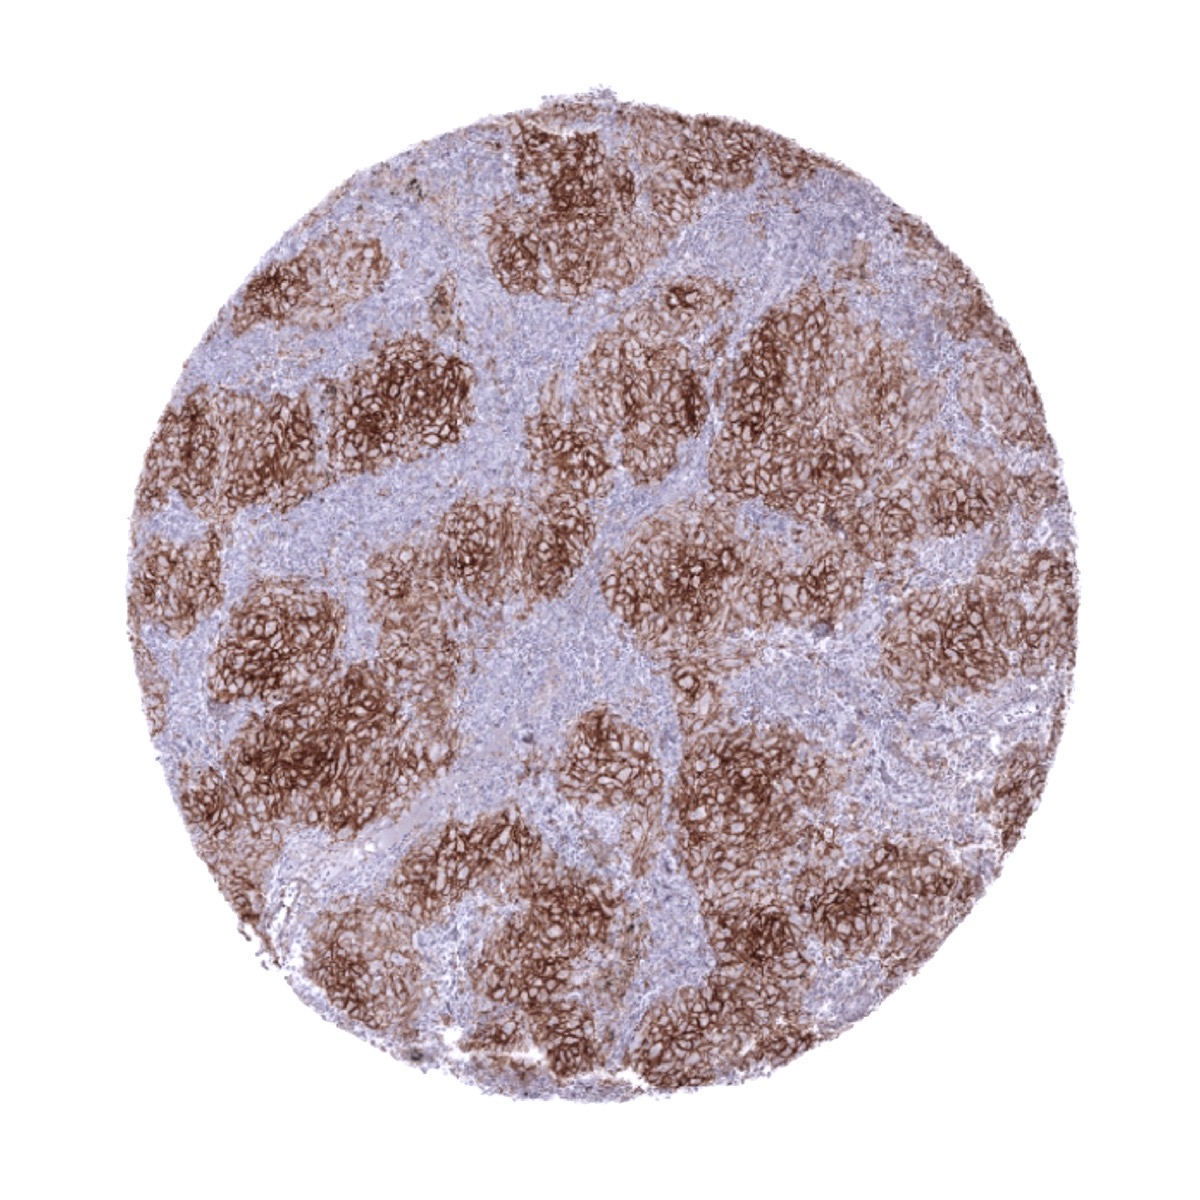
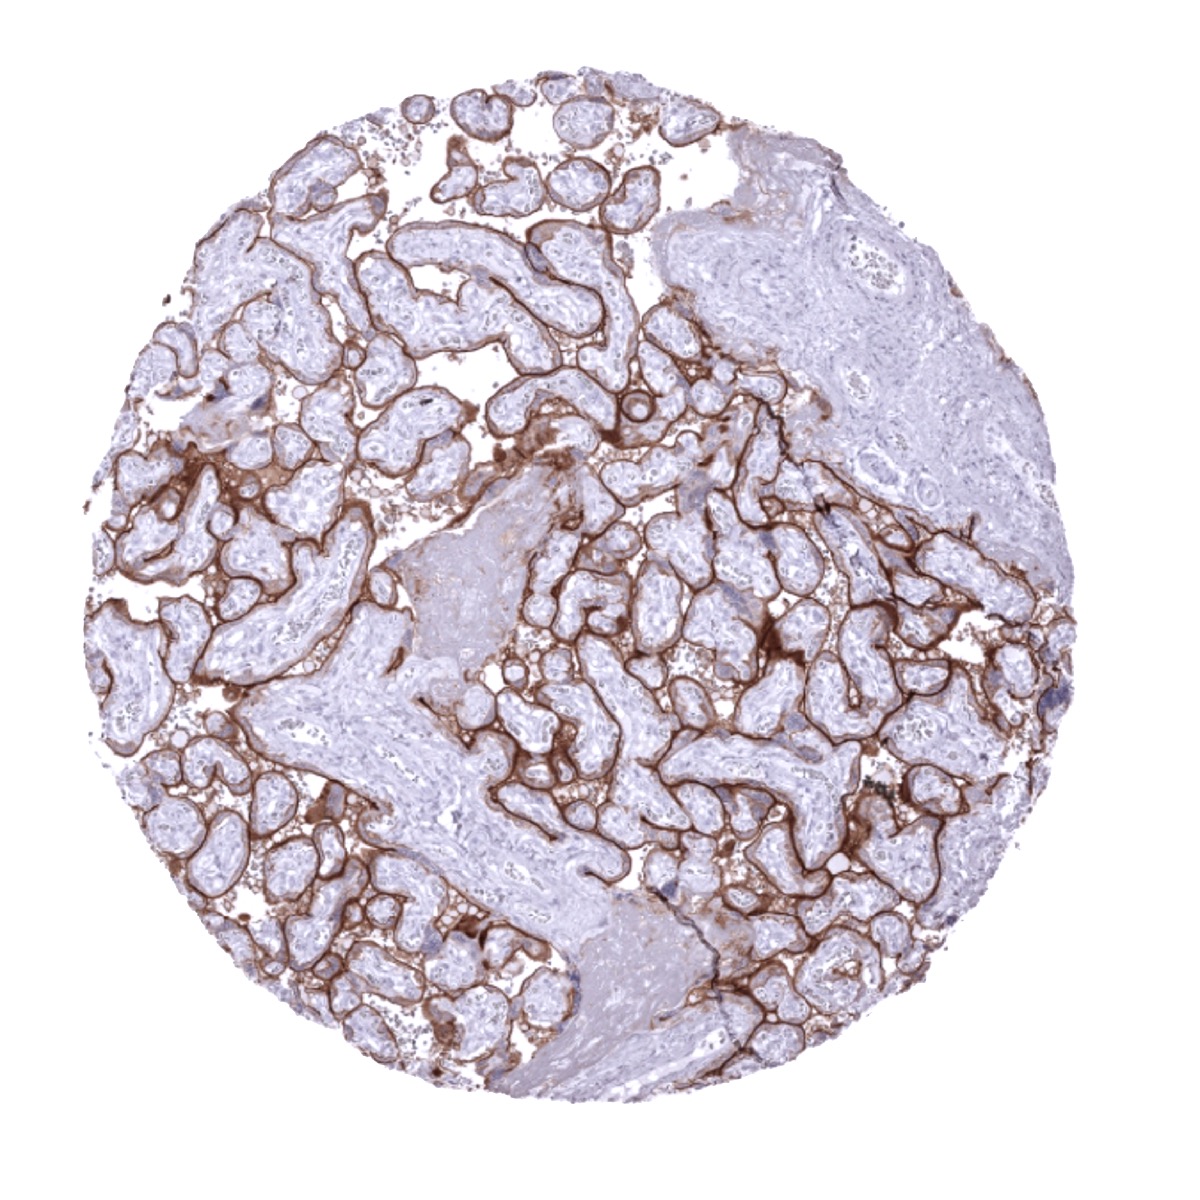
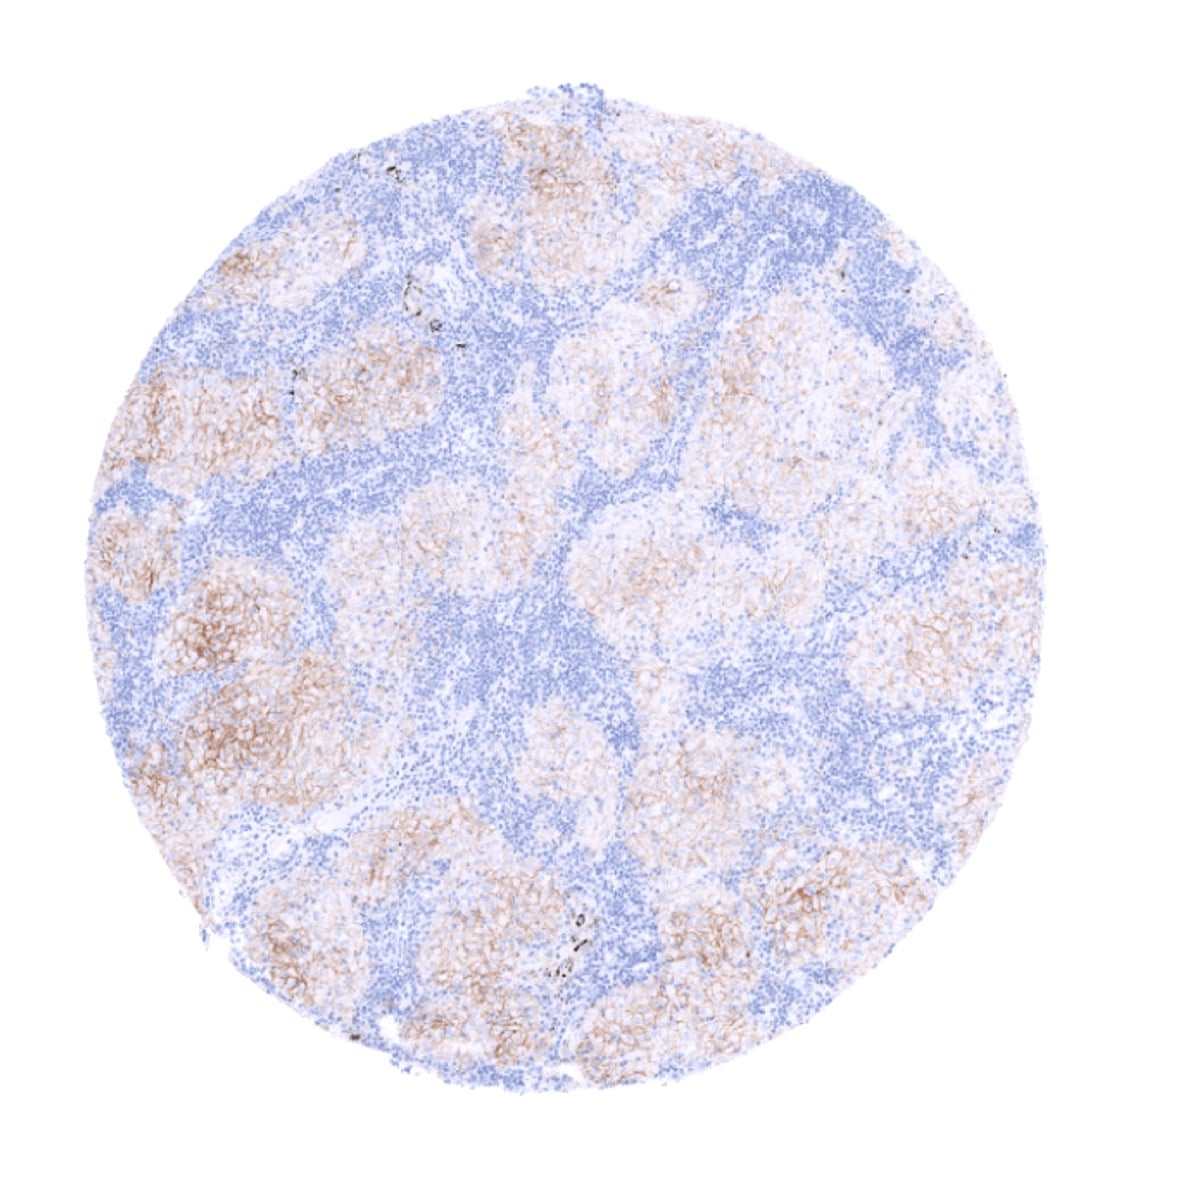
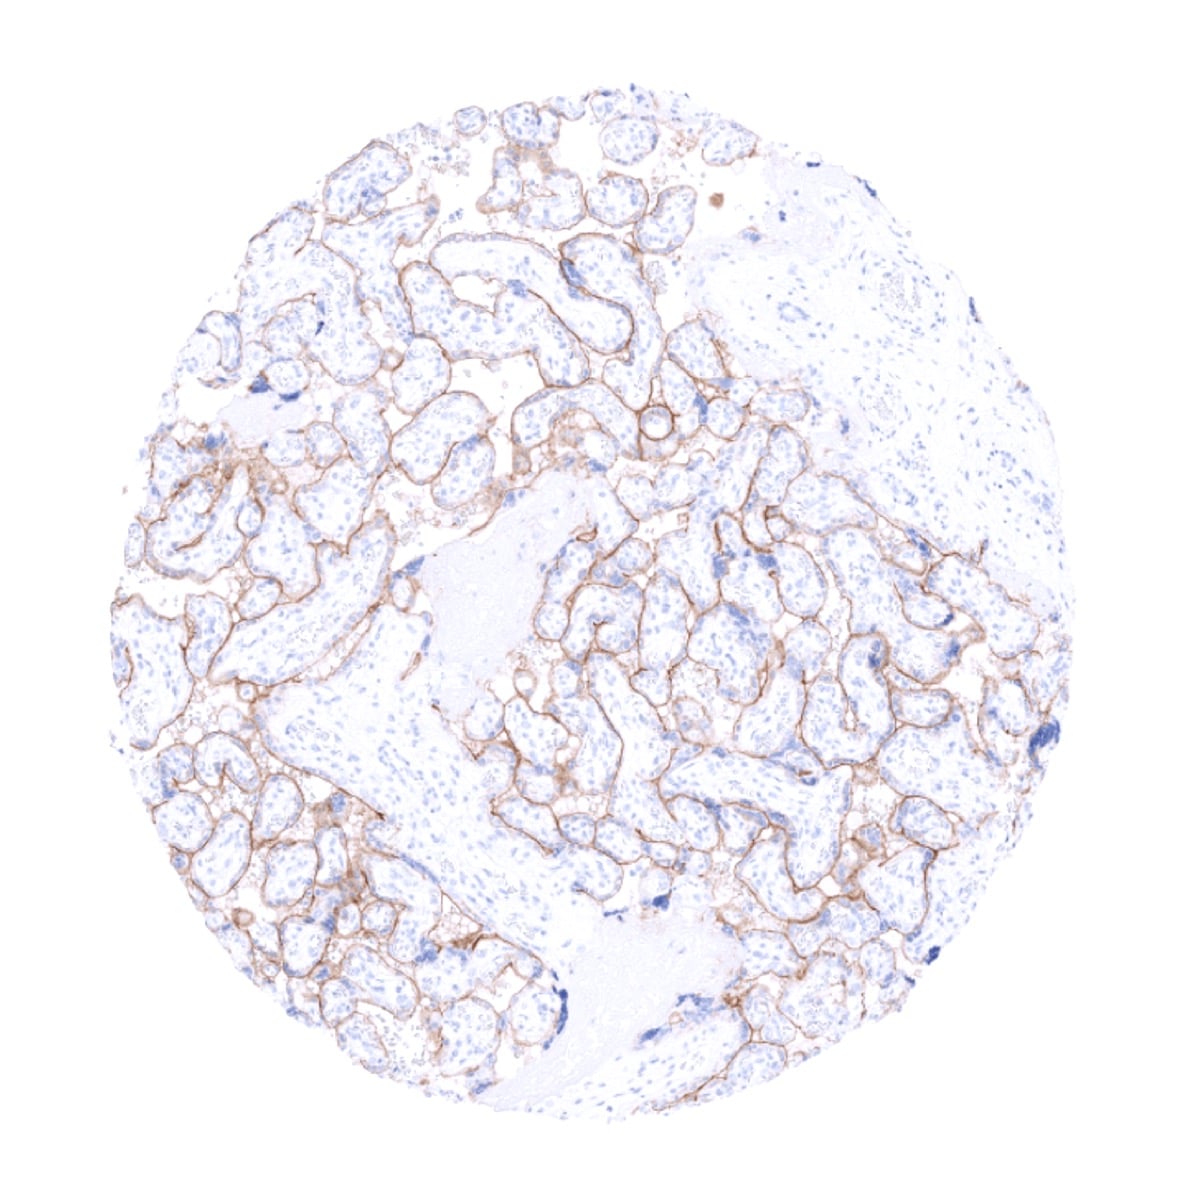
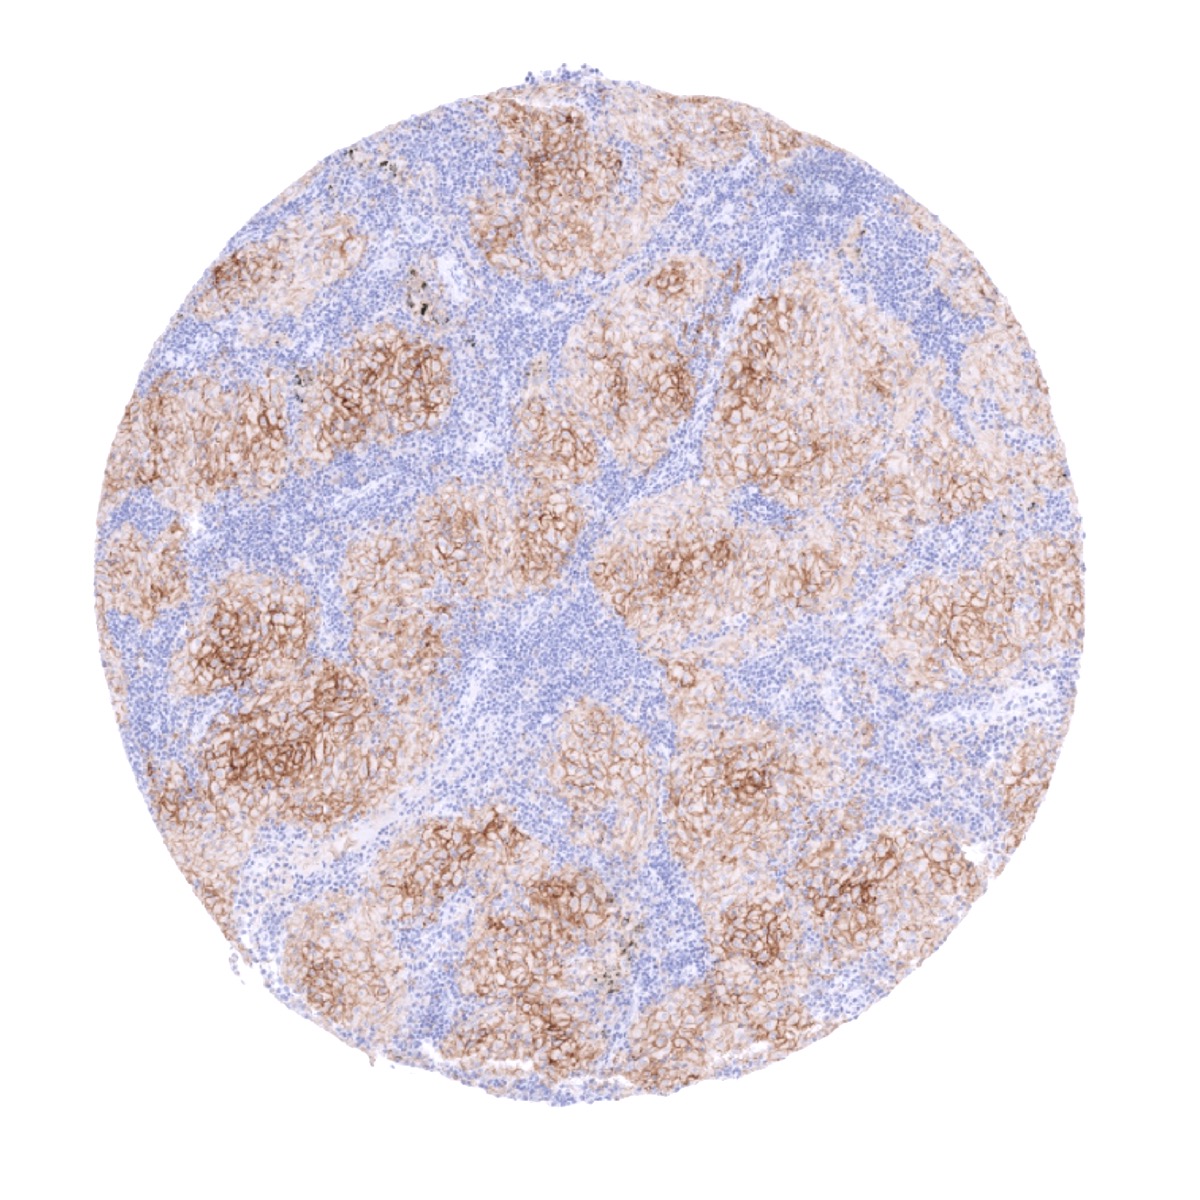
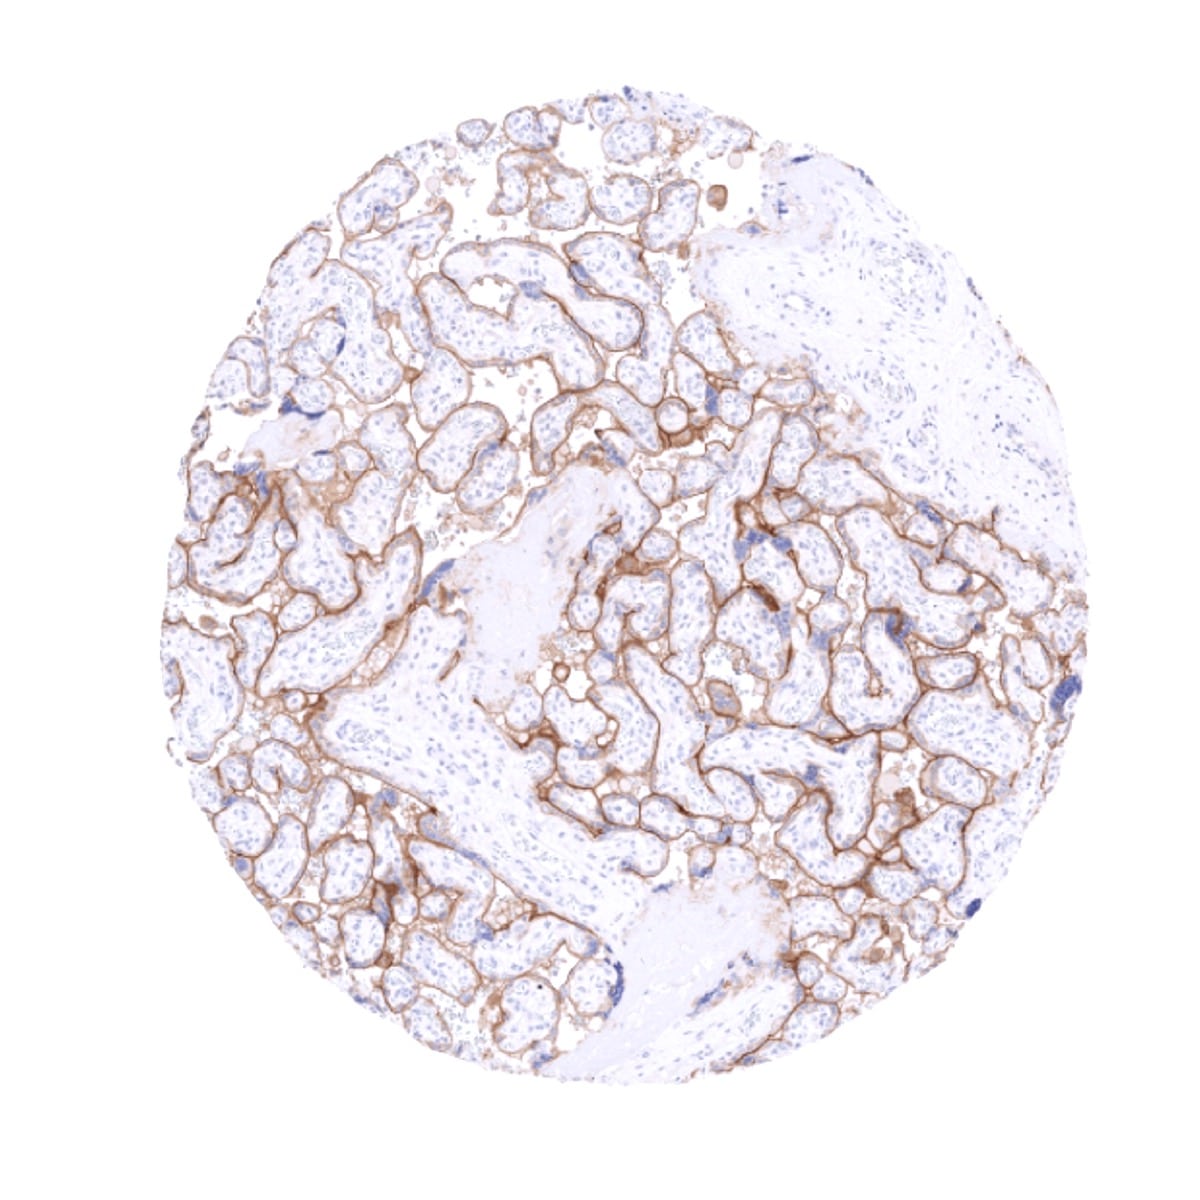
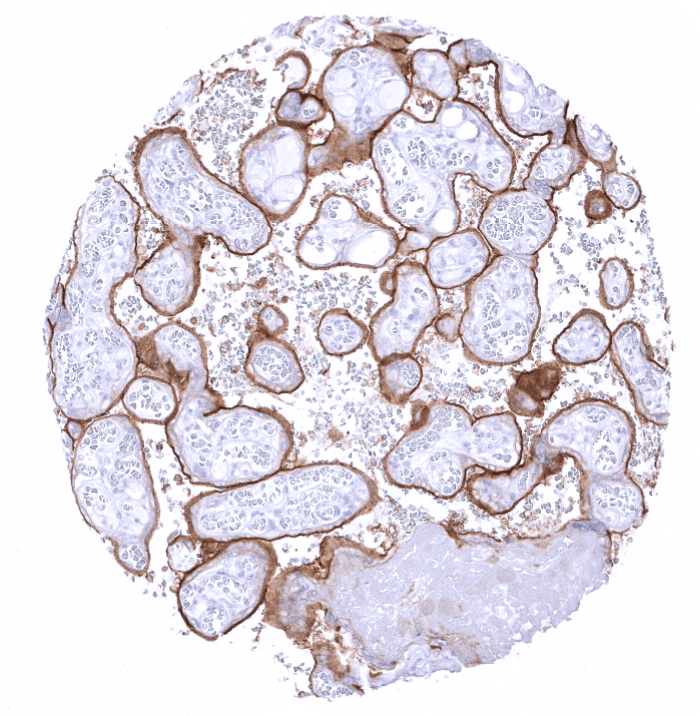
Positive control = Alveolar macrophages, tonsil crypt epithelium and the placental cytotrophoblast show strong, predominantly membranous positivity. Follicle centre macrophages should show at least moderate intensity staining.
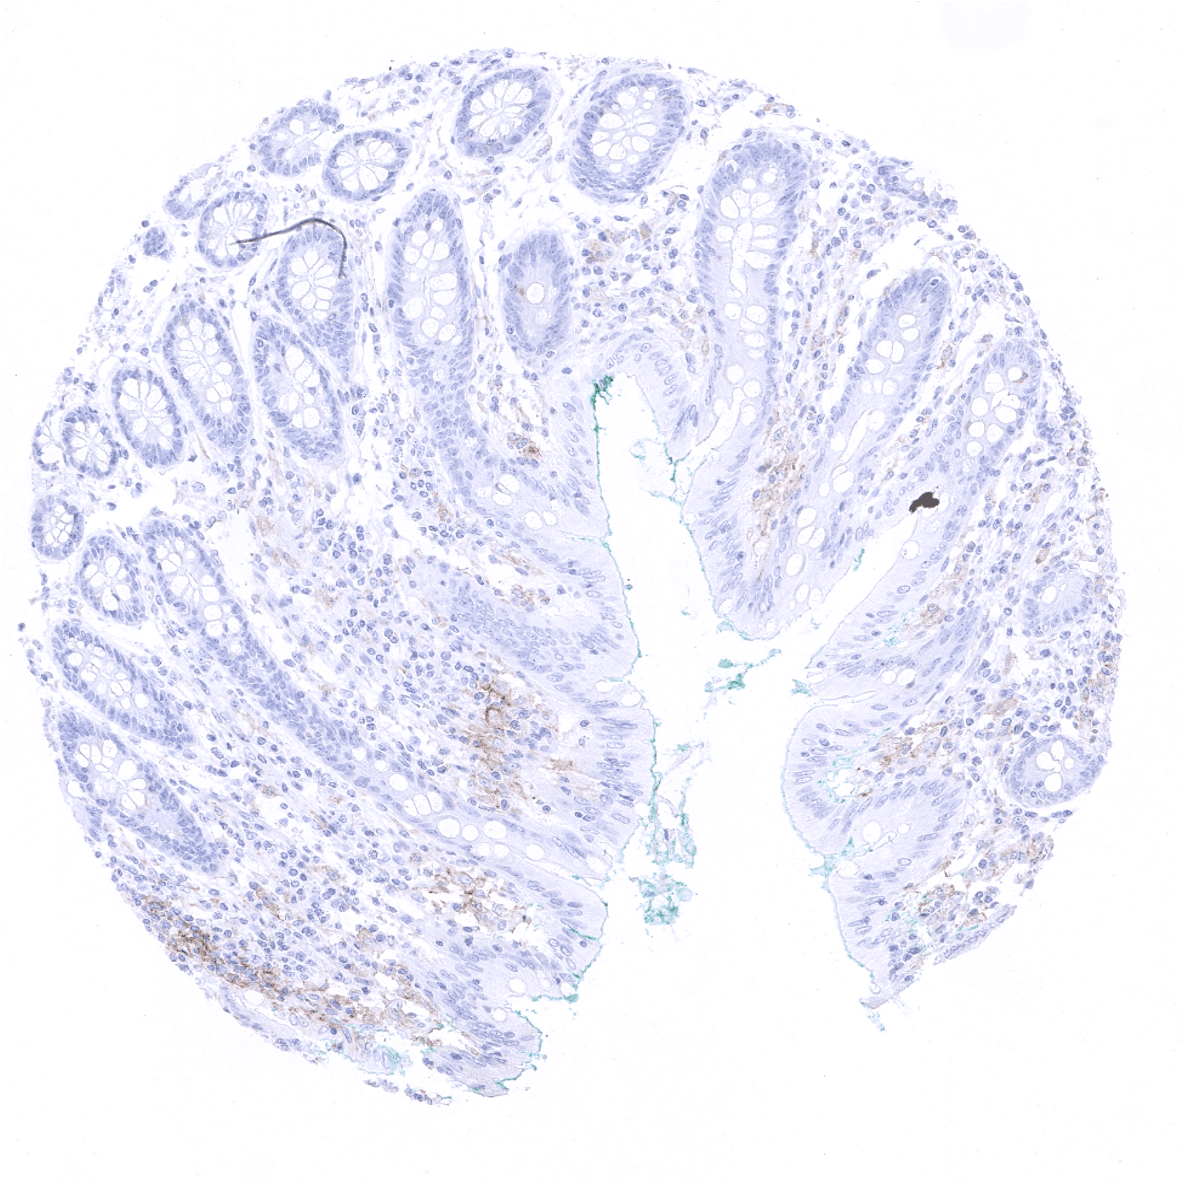
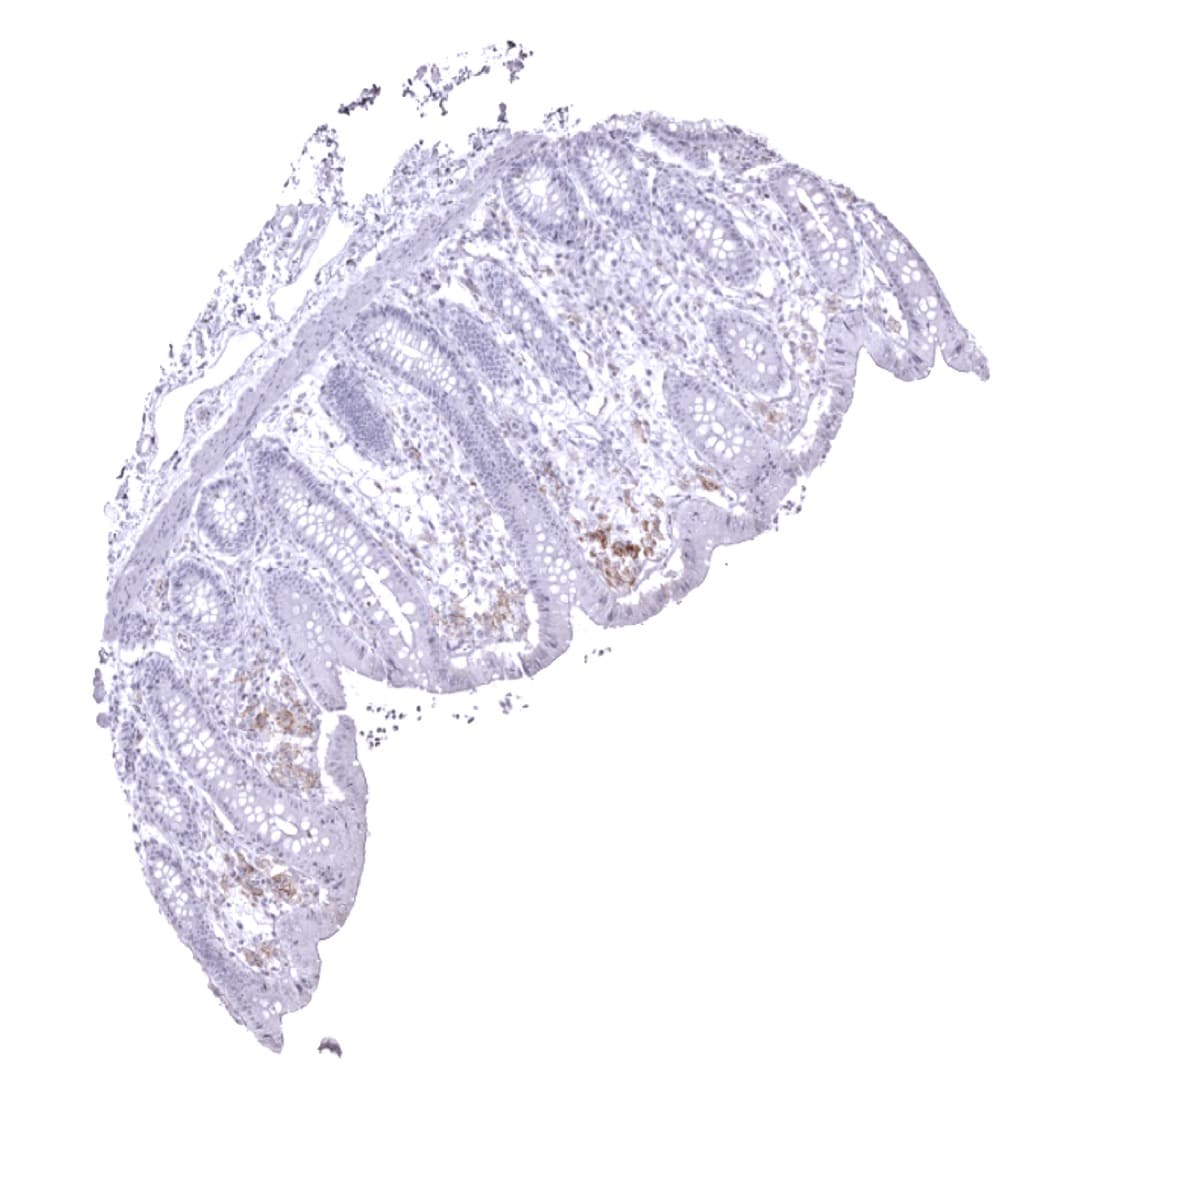
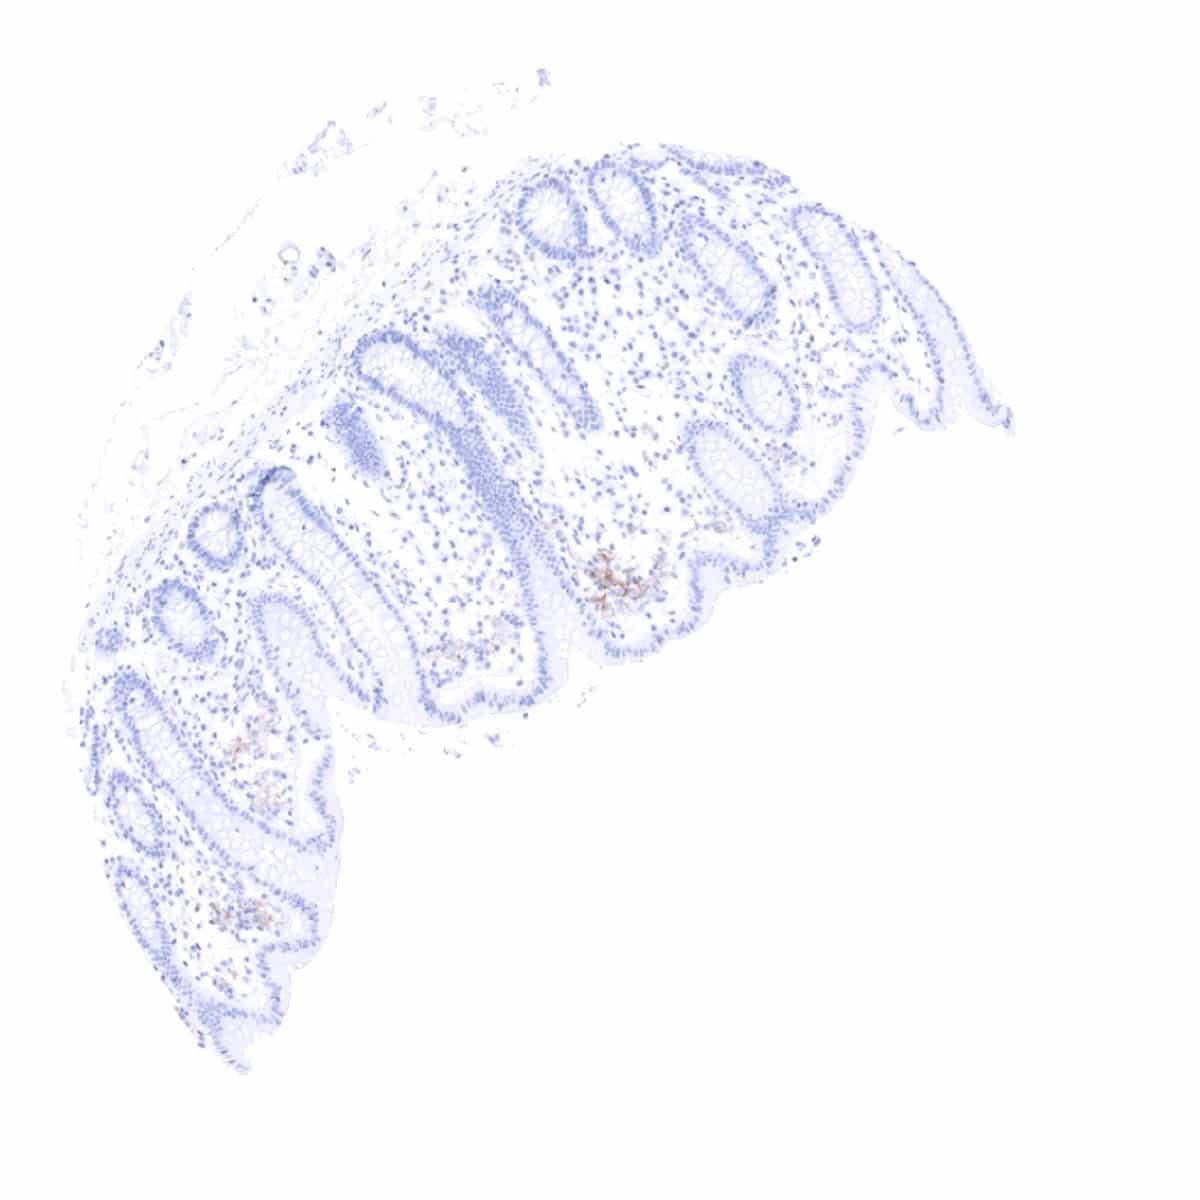
Negative control = Appendix (negative staining of all epithelial cells)
Cellular localization = Predominantly membranous
Reactivity = Human
Application = Immunohistochemistry
Dilution = 1:100 – 1:200
Intended Use = Research Use Only
Relevance of Antibody
PD-L1 is a pivotal protein in immune-oncology.
Biology Behind
Programmed death-ligand 1 (PD-L1) is a 40kDa type 1 transmembrane protein that plays a major role in suppressing the adaptive immune system. Normally, the adaptive immune system reacts to antigens that are associated with immune system activation by exogenous or endogenous danger signals. In turn, clonal expansion of antigen-specific CD8+ T cells and/or CD4+ helper cells is propagated. The binding of PD-L1 to the inhibitory checkpoint molecule PD-1 provides an inhibitory signal to lymphocytes. This lowers the proliferation of antigen-specific T-cells in lymph nodes, while simultaneously decreasing apoptosis in regulatory T cells (anti-inflammatory, suppressive T cells). Upregulation of PD-L1 in tumor cells and/or tumor associated macrophages represents a major mechanism by which cancers can evade the host immune response and consecutive tumor cell killing by tumor infiltrating CD8+ T cells or natural killer (NK) cells. Various antibody drugs targeting PD-1 and PD-L1 (immune checkpoint inhibitors) have proven effective against several types of cancers, especially if these contain elevated numbers of PD-L1 positive inflammatory or cancer cells.
Staining Pattern in Normal Tissues
PD-L1 staining pattern in Normal Tissues with antibody MSVA-711R (Images shown in our “Normal Tissue Gallery”)
| Brain | Cerebrum | Negative. |
| Cerebellum | Negative. | |
| Endocrine Tissues | Thyroid | Negative. |
| Parathyroid | Negative. | |
| Adrenal gland | Negative. | |
| Pituitary gland | Moderate staining of a subset of epithelial cells in the adenohypophysis. | |
| Respiratory system | Respiratory epithelium | Negative. |
| Lung | Intense staining of alveolar macrophages. Epithelial cells are negative. | |
| Gastrointestinal Tract | Salivary glands | Negative. |
| Esophagus | Negative. | |
| Stomach | Negative. | |
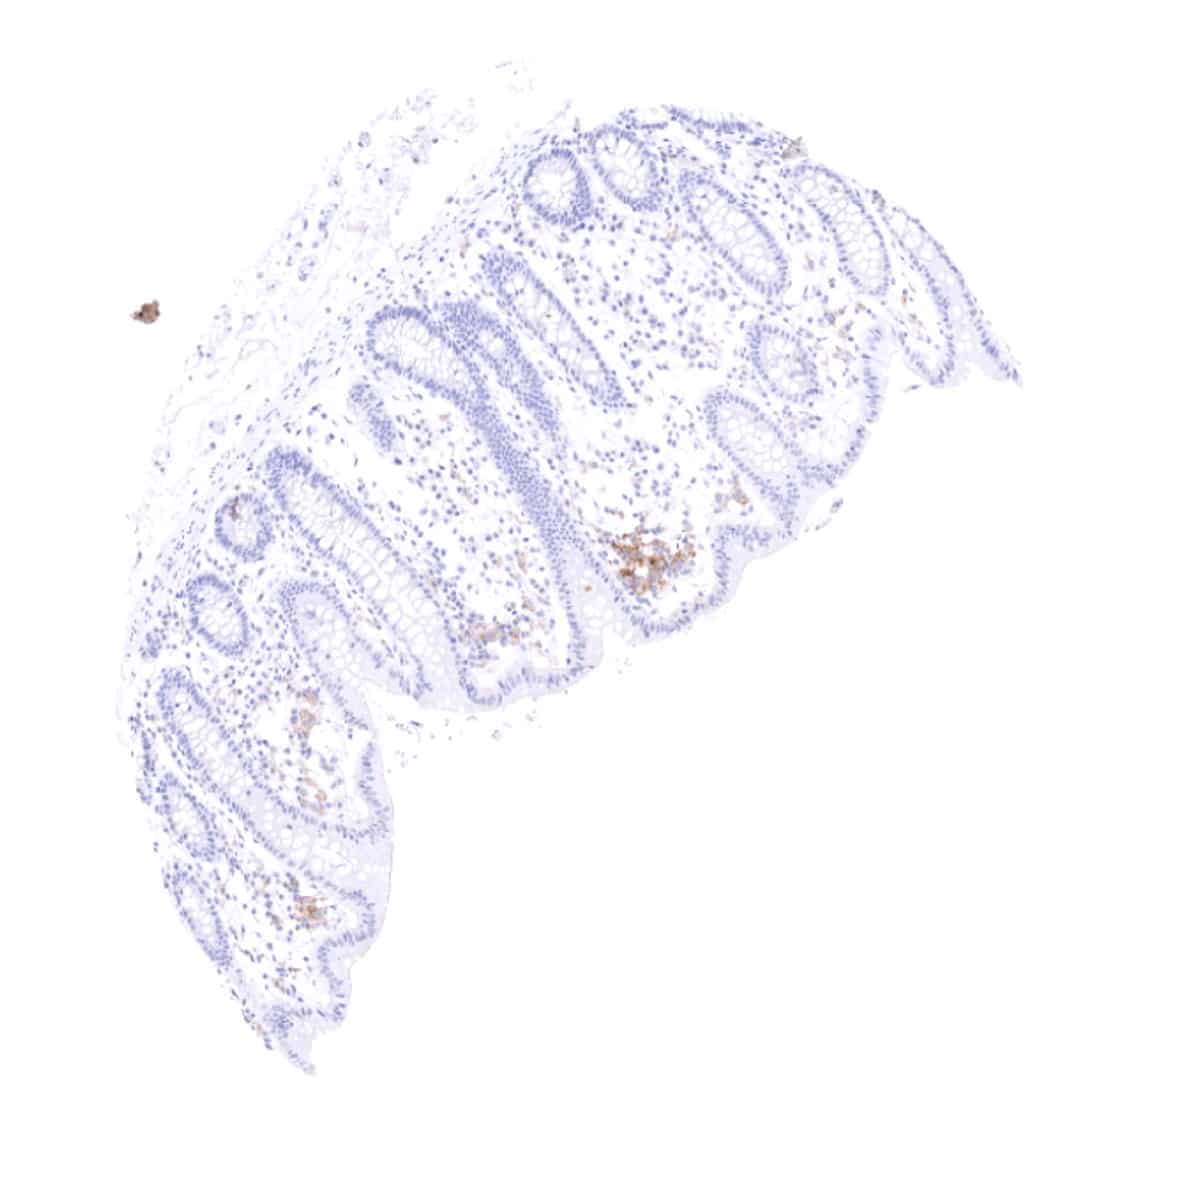
| Duodenum | Moderate to strong staining in macrophages. Epithelial cells are negative. | |
| Small intestine | Moderate to strong staining in macrophages. Epithelial cells are negative. | |
| Colon | Moderate to strong staining in macrophages. Epithelial cells are negative. | |
| Rectum | Moderate to strong staining in macrophages. Epithelial cells are negative. | |
| Liver | Negative. | |
| Gallbladder | Negative. | |
| Pancreas | Negative. | |
| Genitourinary | Kidney | Negative. |
| Urothelium | Negative. | |
| Male genital | Prostate | Negative. |
| Seminal vesicles | Negative. | |
| Testis | Negative. | |
| Epididymis | Negative. | |
| Female genital | Breast | Negative. |
| Uterus, myometrium | Negative. | |
| Uterus, ectocervix | Negative. | |
| Uterus endocervix | Negative. | |
| Uterus, endometrium | Negative. | |
| Fallopian Tube | Negative. | |
| Ovary | Moderate to strong membranous staining of corpus luteum cells. | |
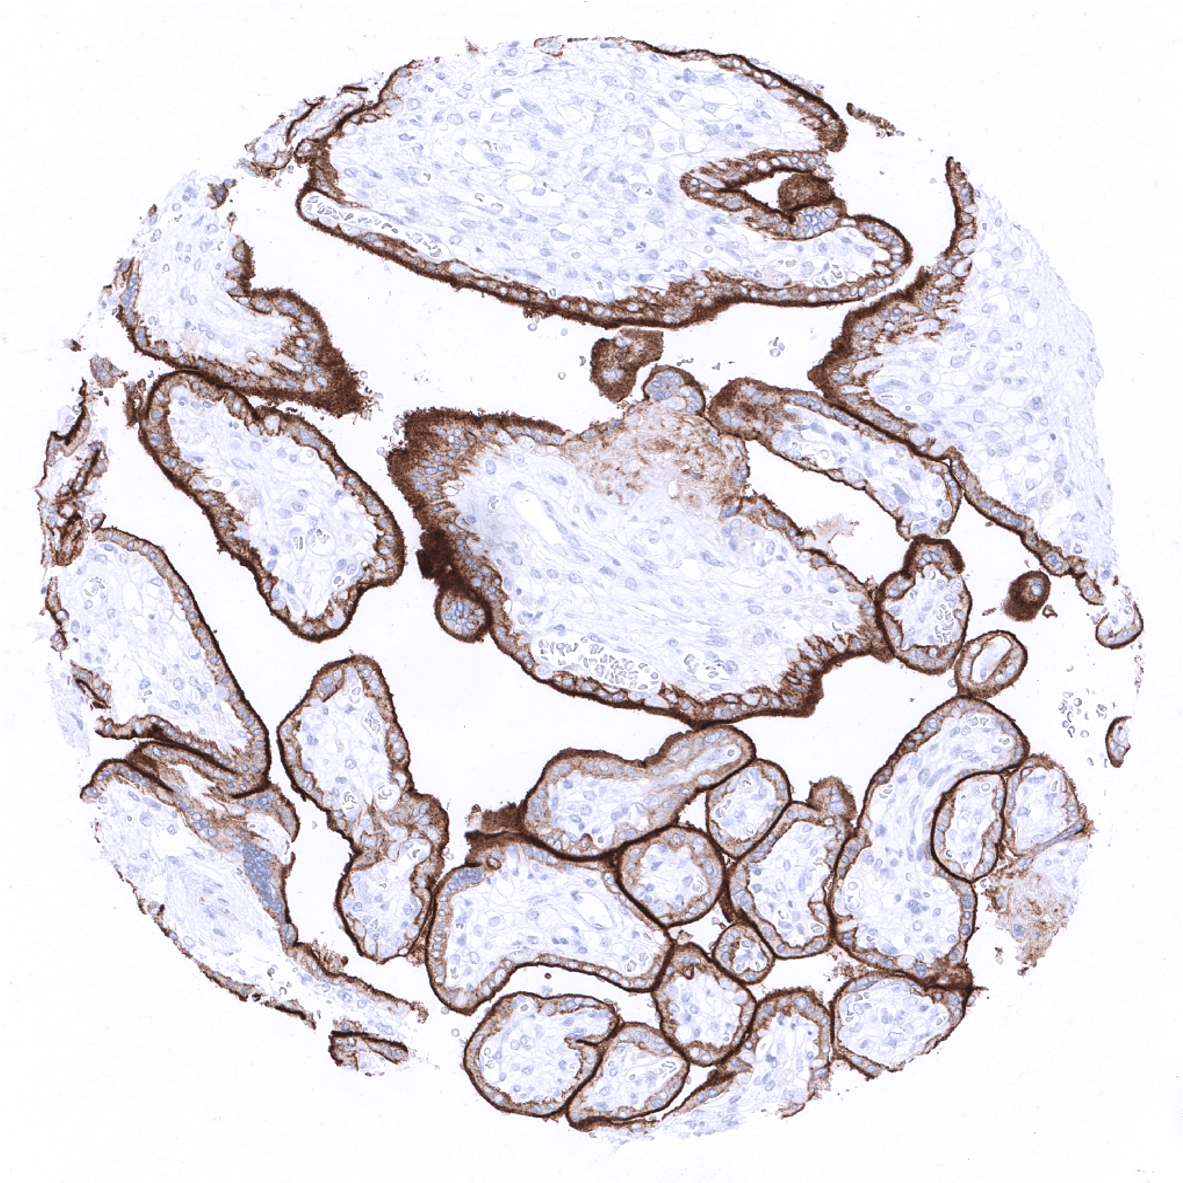
| Placenta early | Strong staining of the external membrane of the syncytiotrophoblast. | |
| Placenta mature | Strong staining of the external membrane of the syncytiotrophoblast. | |
| Amnion | Negative. | |
| Chorion | Weak staining of chorion cells. | |
| Skin | Epidermis | Negative. |
| Sebaceous glands | Negative. | |
| Muscle/connective tissue | Heart muscle | Negative. |
| Skeletal muscle | Negative. | |
| Smooth muscle | Negative. | |
| Vessel walls | Negative. | |
| Fat | Negative. | |
| Stroma | Negative. | |
| Endothelium | Negative. | |
| Bone marrow/lymphoid | Bone marrow | Some PD-L1 positive macrophages may be seen. |
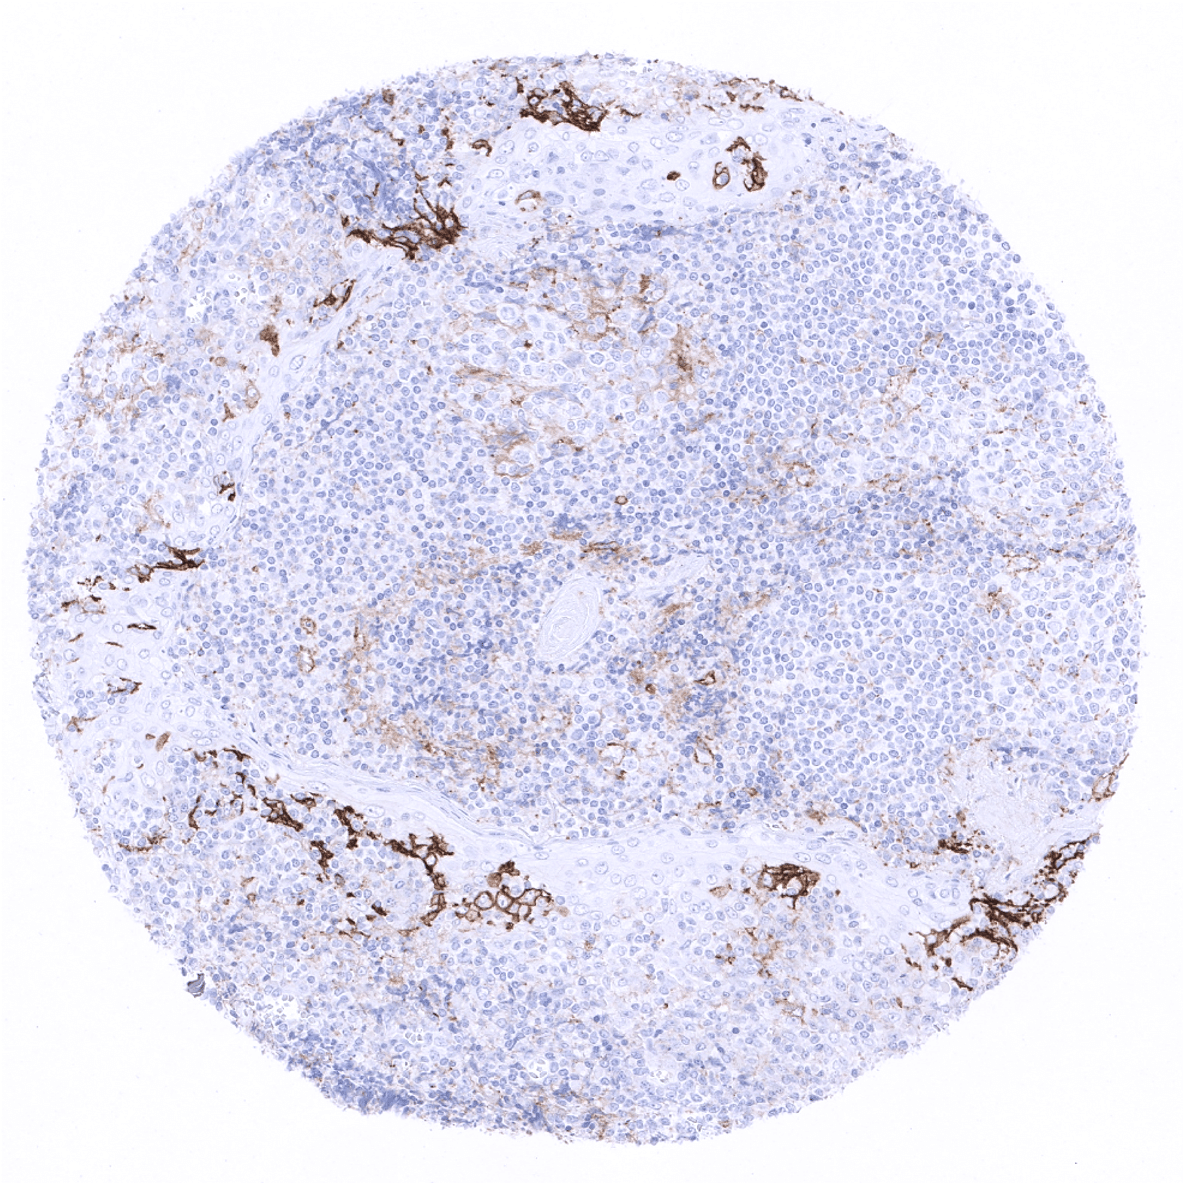
| Lymph node | Moderate to strong staining in dendritic cells and macrophages. | |
| Spleen | Faint staining of venous sinuses (littoral cells) | |
| Thymus | Moderate staining of thymic epithelial cells. Some macrophages may also stain. | |
| Tonsil | Strong PD-L1 staining in a subset of cells of squamous epithelia of the crypts. Moderate to strong staining in dendritic cells and macrophages. | |
| Remarks | Some PD-L1 positive macrophages can basically be found in every normal and diseased tissue. |
These findings substantially complement the data described on PD-L1 expression in the Human protein atlas (Tissue expression PD-L1). In agreement with the RNA data summarized on the site, MSVA-711R stains placenta, lymphatic tissues, pituitary gland (adenohypohysis) and thymic epithelial cells. That corpus luteum (a temporary structure in the ovary with the function to preserve the pregnancy product) was not indicated as a site of PD-L1 expression might represent a sampling issue within the referenced RNA studies.
Suggested positive tissue control: Alveolar macrophages, tonsil crypt epithelium and the placental cytotrophoblast show strong, predominantly membranous positivity. Follicle centre macrophages should show at least moderate intensity staining.
Suggested negative tissue control: Appendix (negative staining of all epithelial cells)
Staining Pattern in Relevant Tumor Types
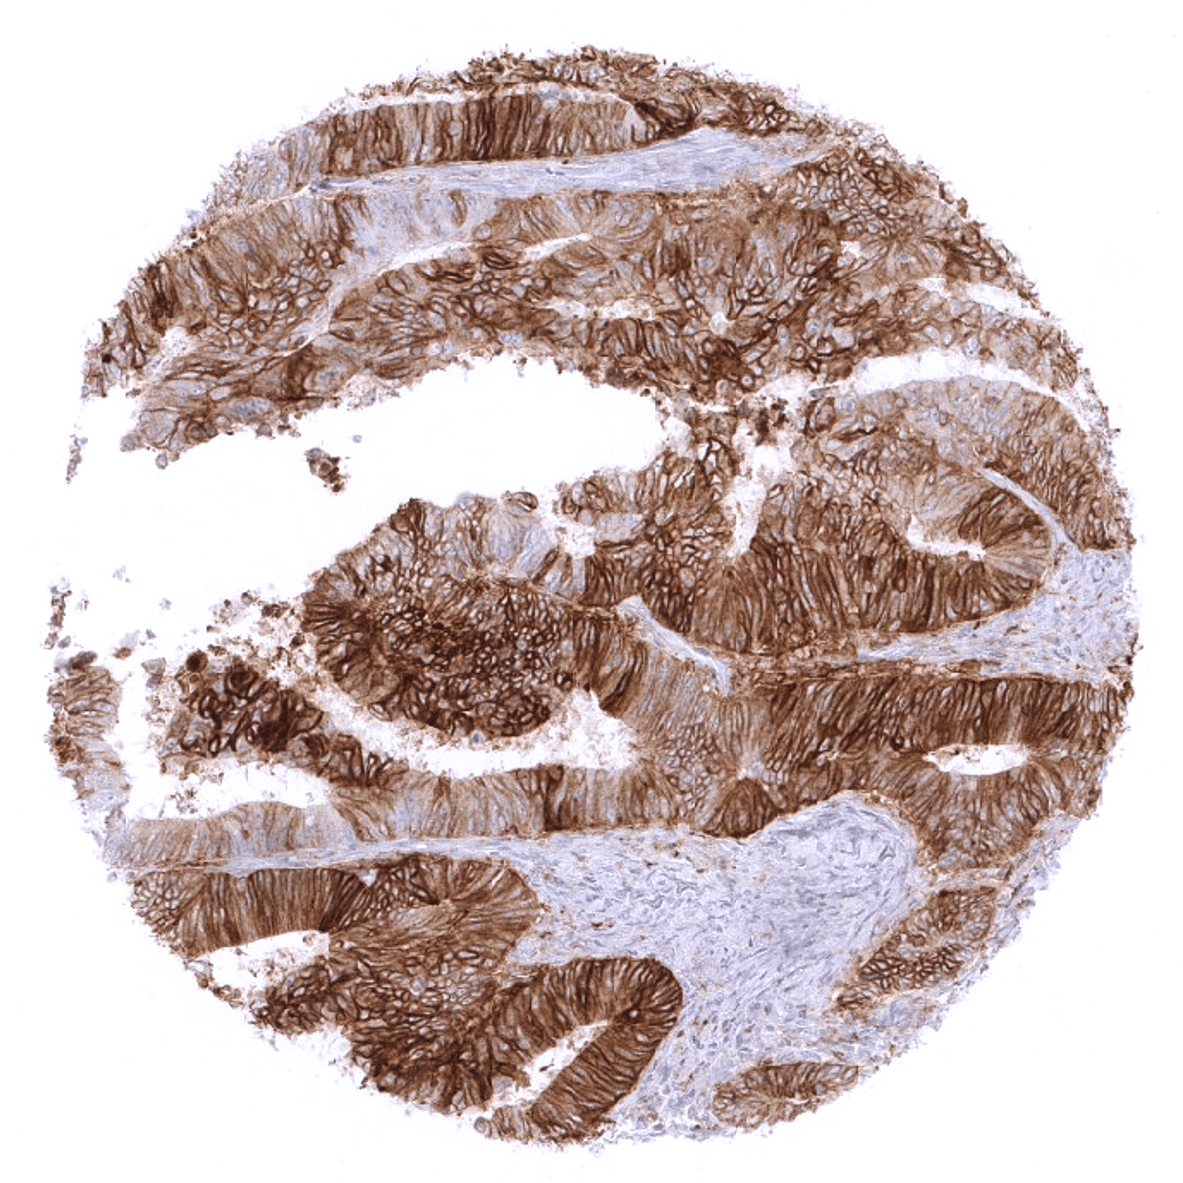
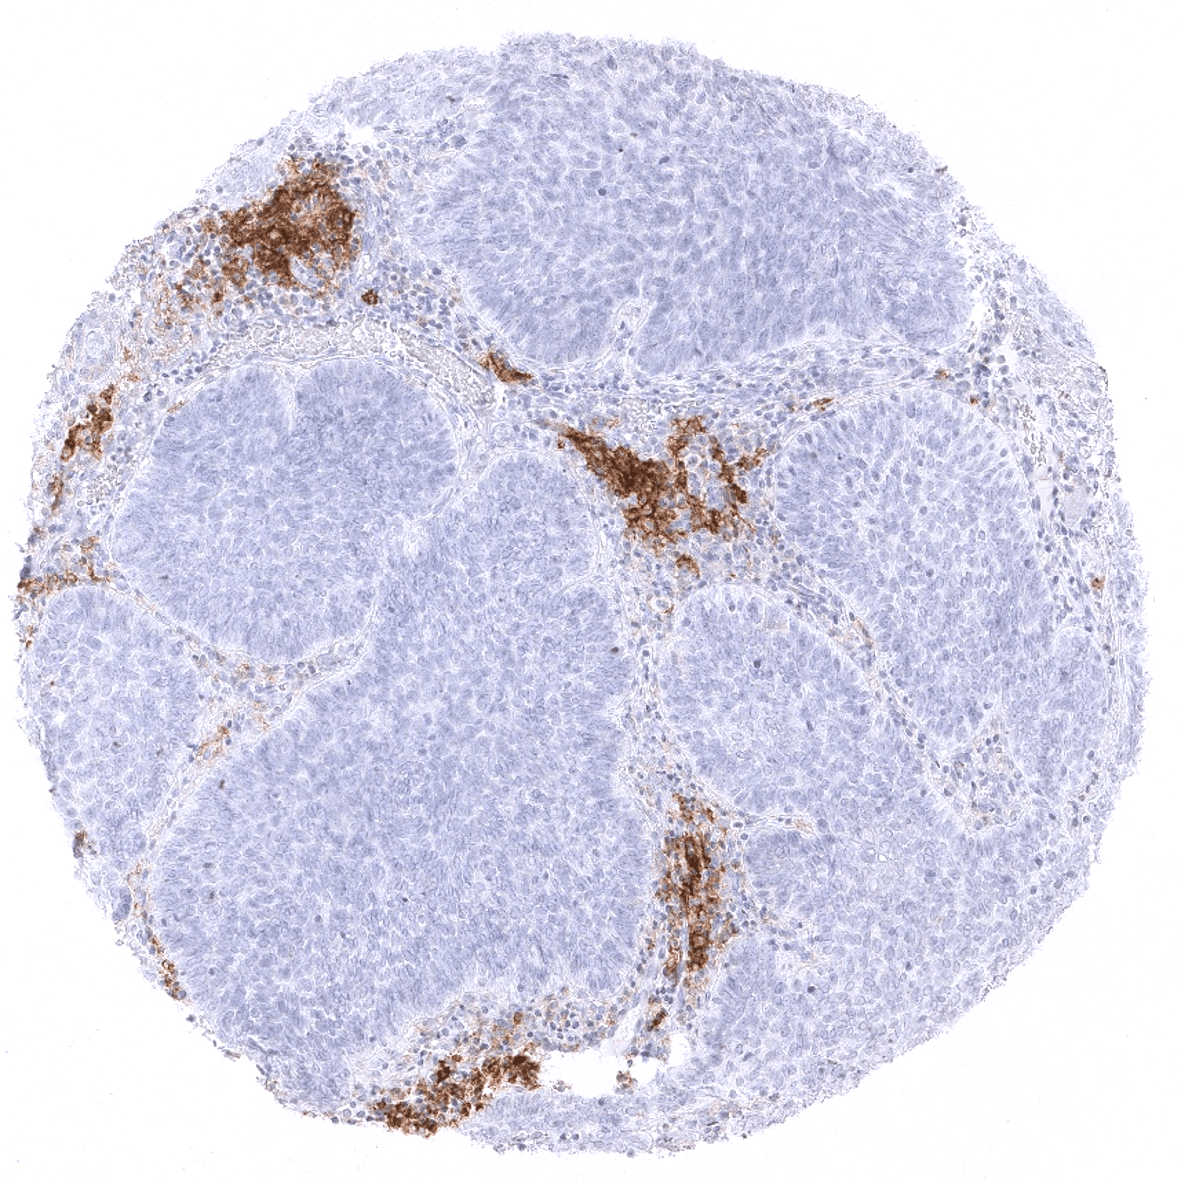
In cancer tissues, patterns of aPD-L1 immunostaining are highly heterogeneous. Staining can involve both cancer cells and tumor associated macrophages. Sometimes these cells types can be difficult to distinguish in brightfield immunohistochemistry. The PD-L1 staining in cancer cells can show variable intensity and may involve the entire tumor or only fractions of it. In some tumors with incomplete staining, positive tumor cells are predominantly or exclusively seen at the invasive border. PD-L1 staining in tumor associated macrophages is also variable and often patchy. In some instances, PD-L1 negative cancer cells are surrounded by a dense layer of strongly PD-L1 expressing cells.
The TCGA findings on PD-L1 RNA expression in different tumor categories have been summarized in the Human Protein Atlas.


Compatibility of Antibodies
PD-L1 (MSVA-711R) publication summary:
Publications used for data compilation:
- Möller et al. “High density of cytotoxic T-lymphocytes is linked to tumoral PD-L1 expression regardless of the mismatch repair status in colorectal cancer”. Published in Acta Oncologica. 2021;60(9):1210-1217.
- Möller et al. “Tumor cell PD-L1 expression is a strong predictor of unfavorable prognosis in immune checkpoint therapy-naive clear cell renal cell cancer”. Published in International Urology and Nephrology. 2021;53(12):2493-2503.
- Möller et al. „PD-L1 expression and CD8 positive lymphocytes in human neoplasms: A tissue microarray study on 11,838 tumor samples”. Published in Cancer Biomarkers. 2023;36(2):177-191.
In these three studies, a total of 14654 tumors from 118 different tumor types were analyzed using the following protocol: Heat-induced antigen retrieval for 5 minutes in an autoclave at 121°C in pH9 Target Retrieval Solution buffer. MSVA-711R was applied at a dilution of 1:150 at 37°C for 60 minutes. Visualization of bound antibody by the EnVision Kit (Dako, Agilent). This protocol was also used for all stainings depicted in our tumor and normal tissue galleries.
At a cut-off level of ≥10% PD-L1 positive tumor cells, a positive immunostaining was seen in 85 (72%) of 118 tumor types. The distribution of positive staining results is shown in an “organ-systematic” and in a “ranking order” figure below (images based on a compilation of data from Möller et al.). Results on possible associations with histopathological and clinical parameters of tumor aggressiveness are also summarized below (table based on data from Möller et al.).
Authors conclusions on diagnostic utility with respect to the distinction of benign versus malignant (Möller et al.):
- not applicable.
Authors conclusions on diagnostic utility with respect to the distinction of different tumor entities (Möller et al.):
- not applicable.
Authors conclusions on prognostic/predictive role of PD-L1 expression (Möller et al.):
- PD-L1 expression in tumor cells is linked to poor prognosis in RCC patients not treated with immune checkpoint inhibitors.
- PD-L1 in colorectal tumor cells is unrelated to features of cancer aggressiveness but strongly linked to high numbers of intratumoral CD8+ T lymphocytes and defective mismatch repair.
Figure 1. PD-L1 staining in cancer (“organ-systematic”; own graphic according to the data from the three papers cited above)

Figure 2. PD-L1 staining in cancer (“ranking order”; own graphic according to the data from the three papers cited above)

Table 3. Clinico-pathological associations described in own graphic according to the data from the three papers cited above)

Protocol Recommendations
IHC users have different preferences on how the stains should look like. Some prefer high staining intensity of the target stain and even accept some background. Others favor absolute specificity and lighter target stains. Factors that invariably lead to more intense staining include higher concentration of the antibody and visualization tools, longer incubation time, higher temperature during incubation, higher temperature and longer duration of the heat induced epitope retrieval (slide pretreatment). The impact of the pH during slide pretreatment has variable effects and depends on the antibody and the target protein.
All images and data shown here and in our image galleries are obtained by the manual protocol described below. Other protocols resulting in equivalent staining are described as well.
Manual protocol
Freshly cut sections should be used (less than 10 days between cutting and staining). Heat-induced antigen retrieval for 5 minutes in an autoclave at 121°C in pH 7,8 Target Retrieval Solution buffer. Apply MSVA-711R at a dilution of 1:150 at 37°C for 60 minutes. Visualization of bound antibody by the EnVision Kit (Dako, Agilent) according to the manufacturer’s directions.
Agilent / Dako – Autostainer Link 48
Pretreatment in PT-Link for 30 minutes at 95°C (pH high); FLEX peroxidase blocking for 5 minutes (room temperature), MSVA-711R 1:150 for 20 minutes (room temperature), FLEX+ mouse/rabbit (LINKER) for 15 minutes (room temperature), horseradish peroxidase (HRP) for 20 minutes (room temperature), FLEX DAB+Sub-Chromo for 10 minutes (room temperature), FLEX hematoxylin for 5 minutes (room temperature).
These images reflect stainings by the protocol described above. It is of note that a comparable staining result can also be obtained by different protocols. In general, a longer pretreatment, a longer incubation time of the primary antibody, a higher antibody concentration, and a longer incubation time of FLEX+LINKER result in stronger staining, potentially at the cost of more background staining. Modifications of the protocol with a strengthening effect on staining intensity in combination with changes of other parameters that result in lower staining intensity can result in a comparable result as shown above.
Leica – BOND RX
Dewax at 72°C for 30 seconds; Pretreatment in Bond Epitope Retrieval Solution (ER2 – EDTA pH9) for 20 minutes at 100°C; Peroxidase blocking for 5 minutes (room temperature), MSVA-711R 1:150 for 15 minutes (room temperature), Post primary (rabbit anti mouse) for 8 minutes (room temperature), Polymer (goat anti rabbit) for 8 minutes (room temperature), mixed DAB refine for 10 minutes (room temperature), hematoxylin for 5 minutes (room temperature).
These images reflect stainings by the protocol described above. It is of note that a comparable staining result can also be obtained by different protocols. In general, a longer pretreatment, a longer incubation time of the primary antibody, a higher antibody concentration, a higher temperature during incubation, and a longer incubation time of Post primary and or the Polymer result in stronger staining, potentially at the cost of more background staining. Modifications of the protocol with a strengthening effect on staining intensity in combination with changes of other parameters that result in lower staining intensity can result in a comparable result as shown above.
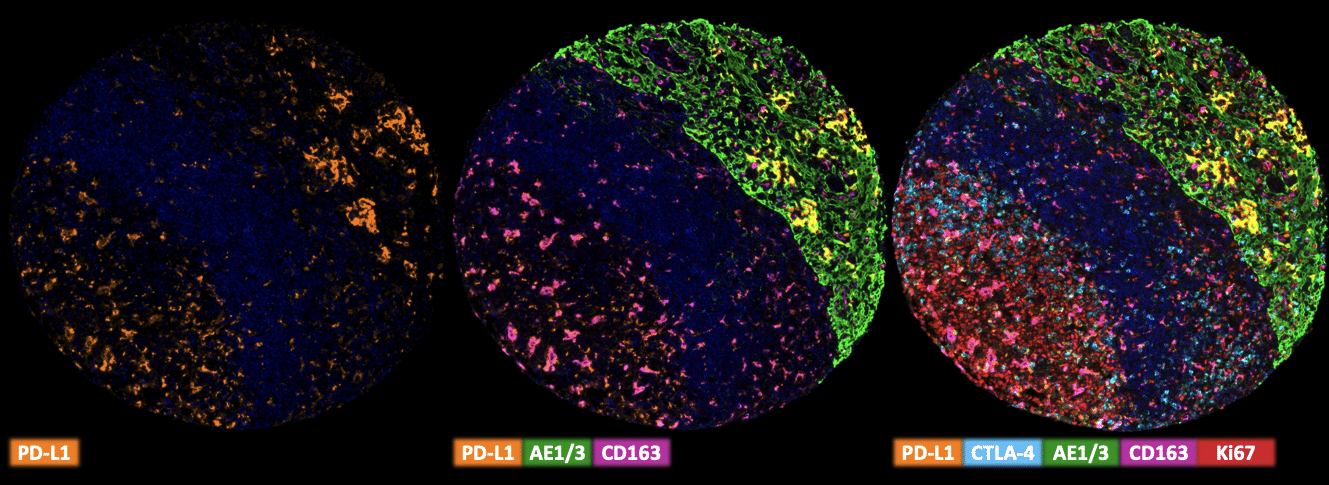
Multiplex Fluorescence Immunohistochemistry
Freshly cut sections should be used (less than 10 days between cutting and staining). Slides were initially boiled in an autoclave (30 min at 100–120 °C in pH9 buffer) for antigen retrieval. The antibody panel consists of PD-L1 (MSVA-711R – 1:150), CTLA-4 (MSVA-152R 1:75), CD163 (MSVA-163M – 1:150), CD4 (MSVA-004R – 1:150) & Ki-67 (MSVA-267M – 1:150). The OPAL dye kit (Cat# NEL811001KT, AKOYA Biosciences, Menlo Park, California, United States) according to the manufacturer’s directions was used to detect the primary antibodies.
Impact of pH


MSVA-711R results in strongest staining if pH9,0 is used for slide pretreatment. pH7,8 is acceptable but lower pH results in a significant reduction of sensitivity.
Potential pitfalls
- The distinction of PD-L1 positive macrophages from scattered positive tumor cells may be difficult
Potential Research Applications
- Given the role of PD-L1 as a pivotal immune checkpoint, PD-L1 is of critical interest in immuno-oncologic research.
- The quantity of PD-L1 expressing tumor and inflammatory cells and their spatial relationship with effector cells is under investigation for predicting response to immune checkpoint inhibitors targeting the PD1/PD-L1 axis.
Evidence for Antibody Specificity in IHC
Specificity of MSVA-711R is documented by strong positive staining in cell types that are well documented to express PD-L1 such as dendritic cells and macrophages of lymphoid tissues, alveolar macrophages of the lung, squamous epithelia of the tonsil crypts, littoral cells in the spleen and the syncytiotrophoblast of the placenta. In addition, PD-L1 staining in absent in these tissues known to not express PD-L1 including tissues notorious for non-specific IHC background such as kidney, colonic mucosa, and epidermis.
