195,00 € – 695,00 €
Product details
Synonyms = Adenocarcinoma-associated Antigen; Cell Surface Glycoprotein Trop-1; EGP2; EGP314; EGP40; Epithelial Cell Adhesion Molecule; Epithelial Glycoprotein 314; ESA; KSA; TACD1; TROP1; Tumor-associated Calcium Signal Transducer 1 (TACSTD1); ECS-1; Epidermal Surface Antigen 1; ESA1; FLOT2; Flotillin-2; Membrane Component, Chromosome 17, Surface Marker-1 (M17S1); REG-1; Reggie-1; Reggie-2
Antibody type = Recombinant Rabbit monoclonal / IgG
Clone = MSVA-326R
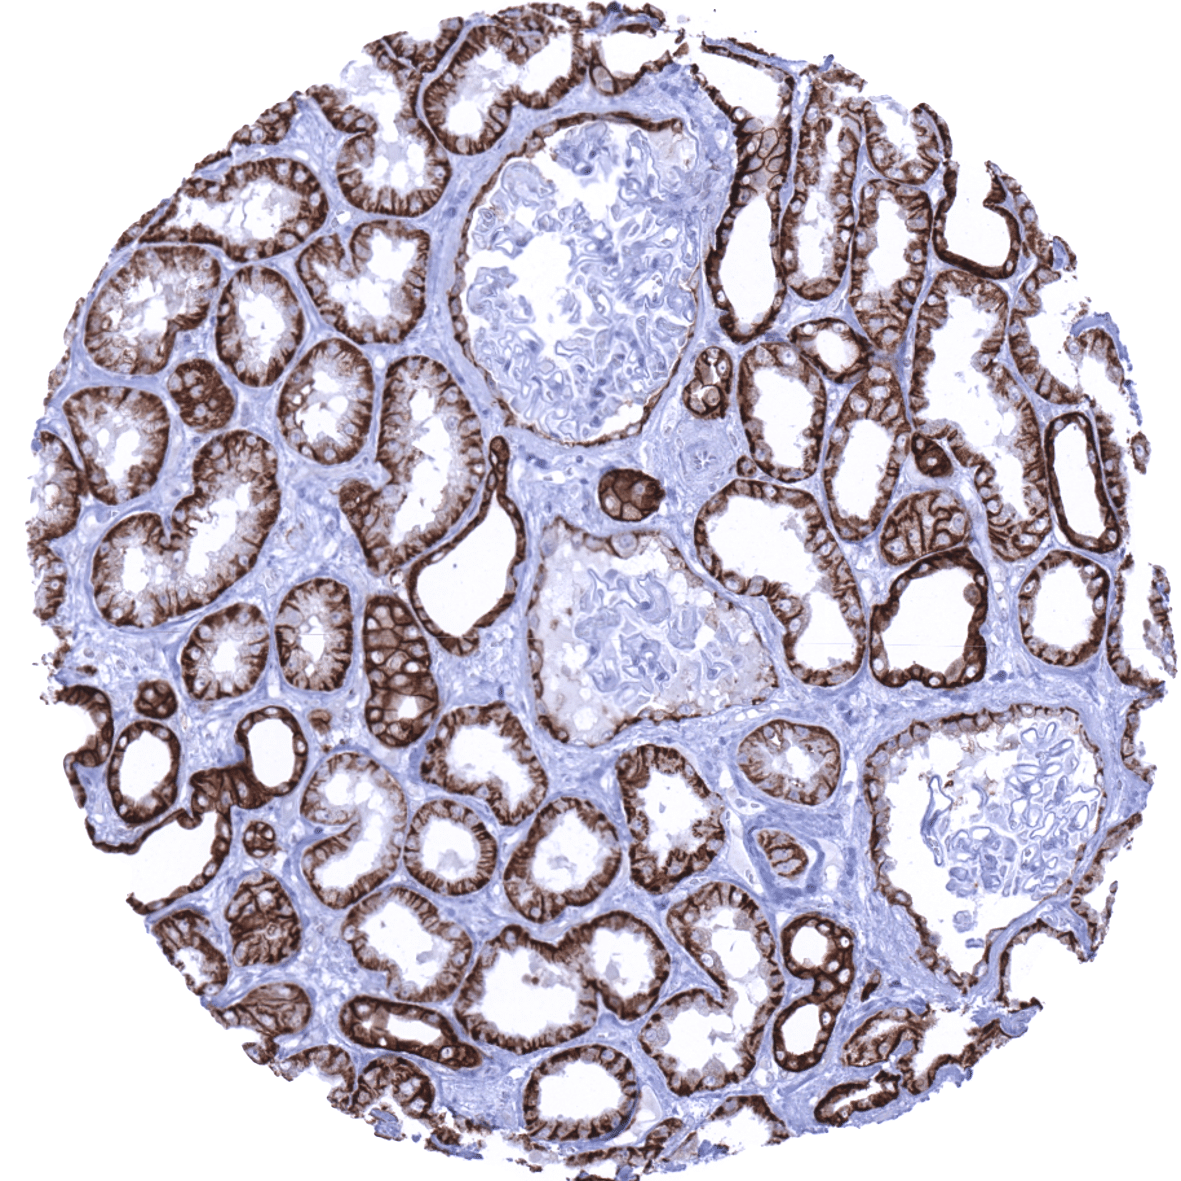
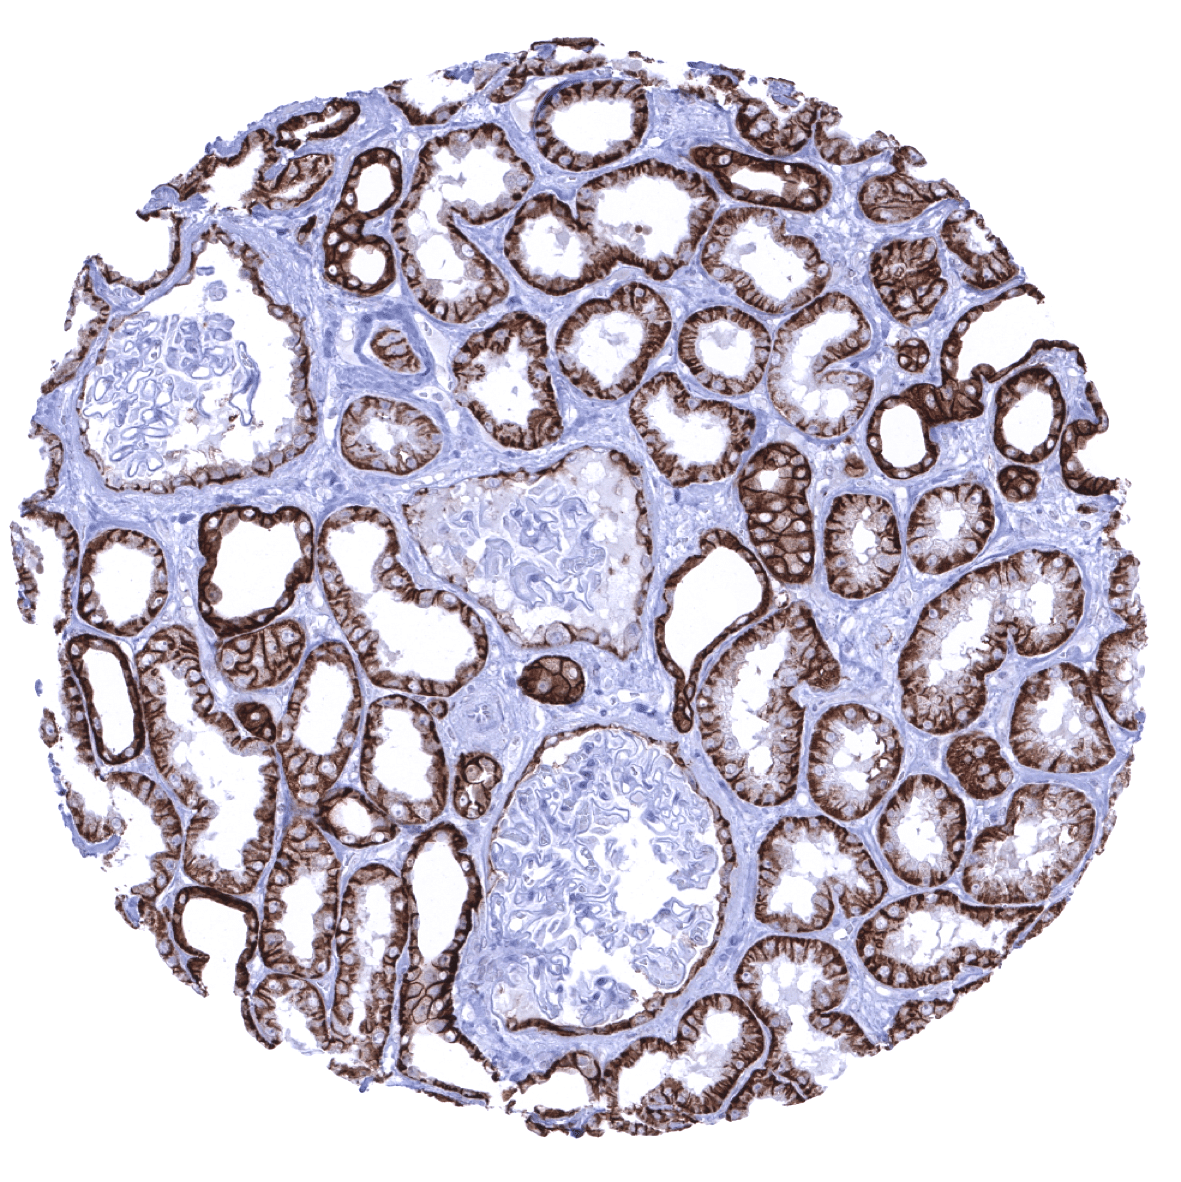
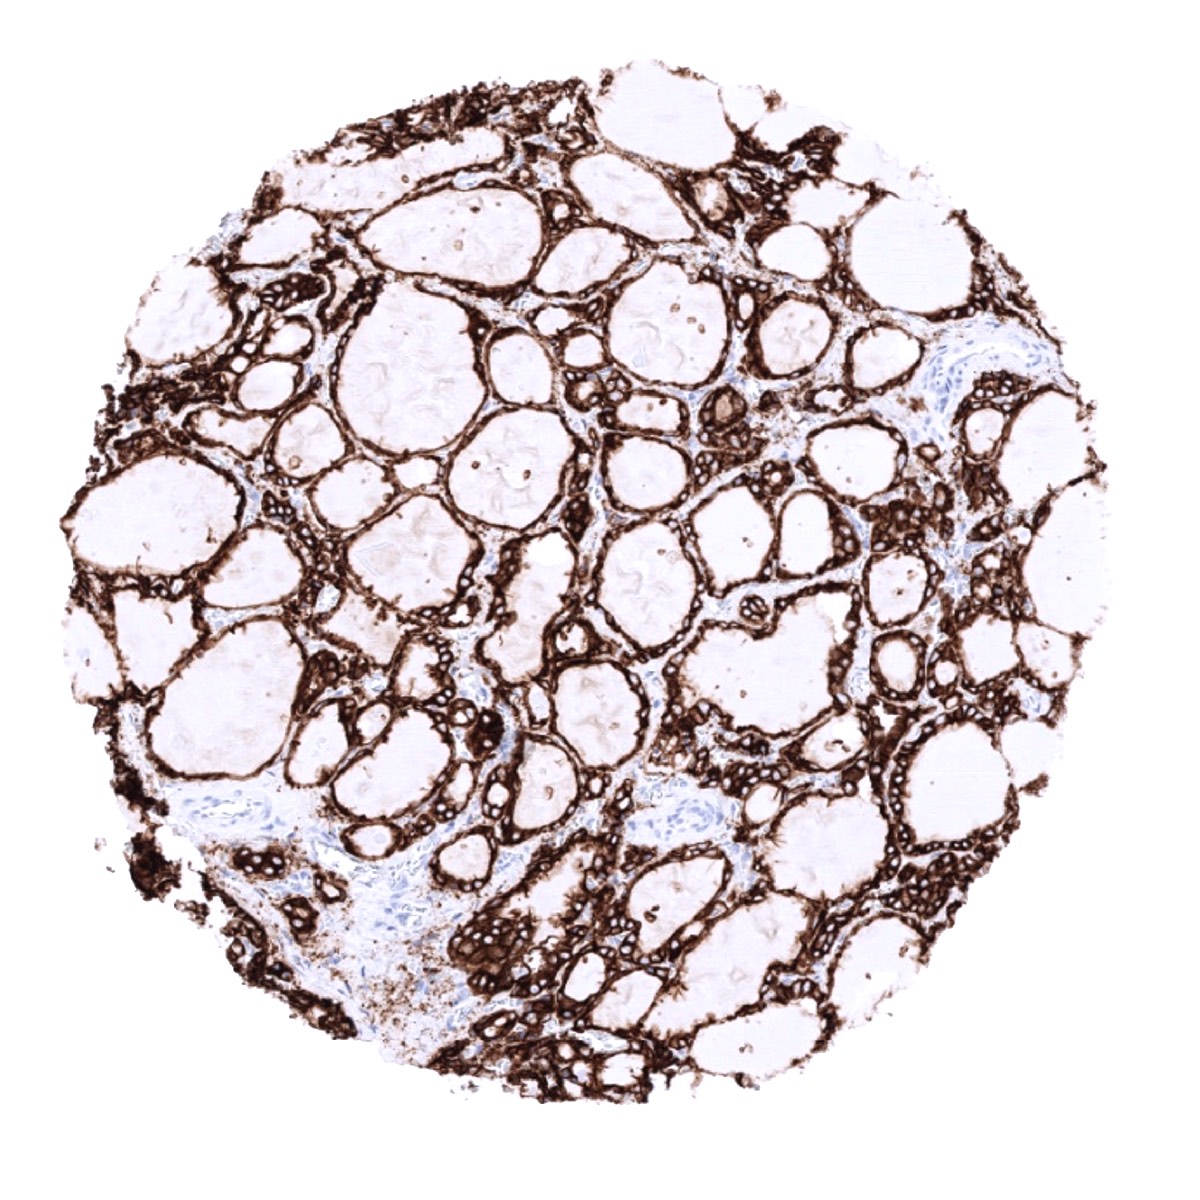
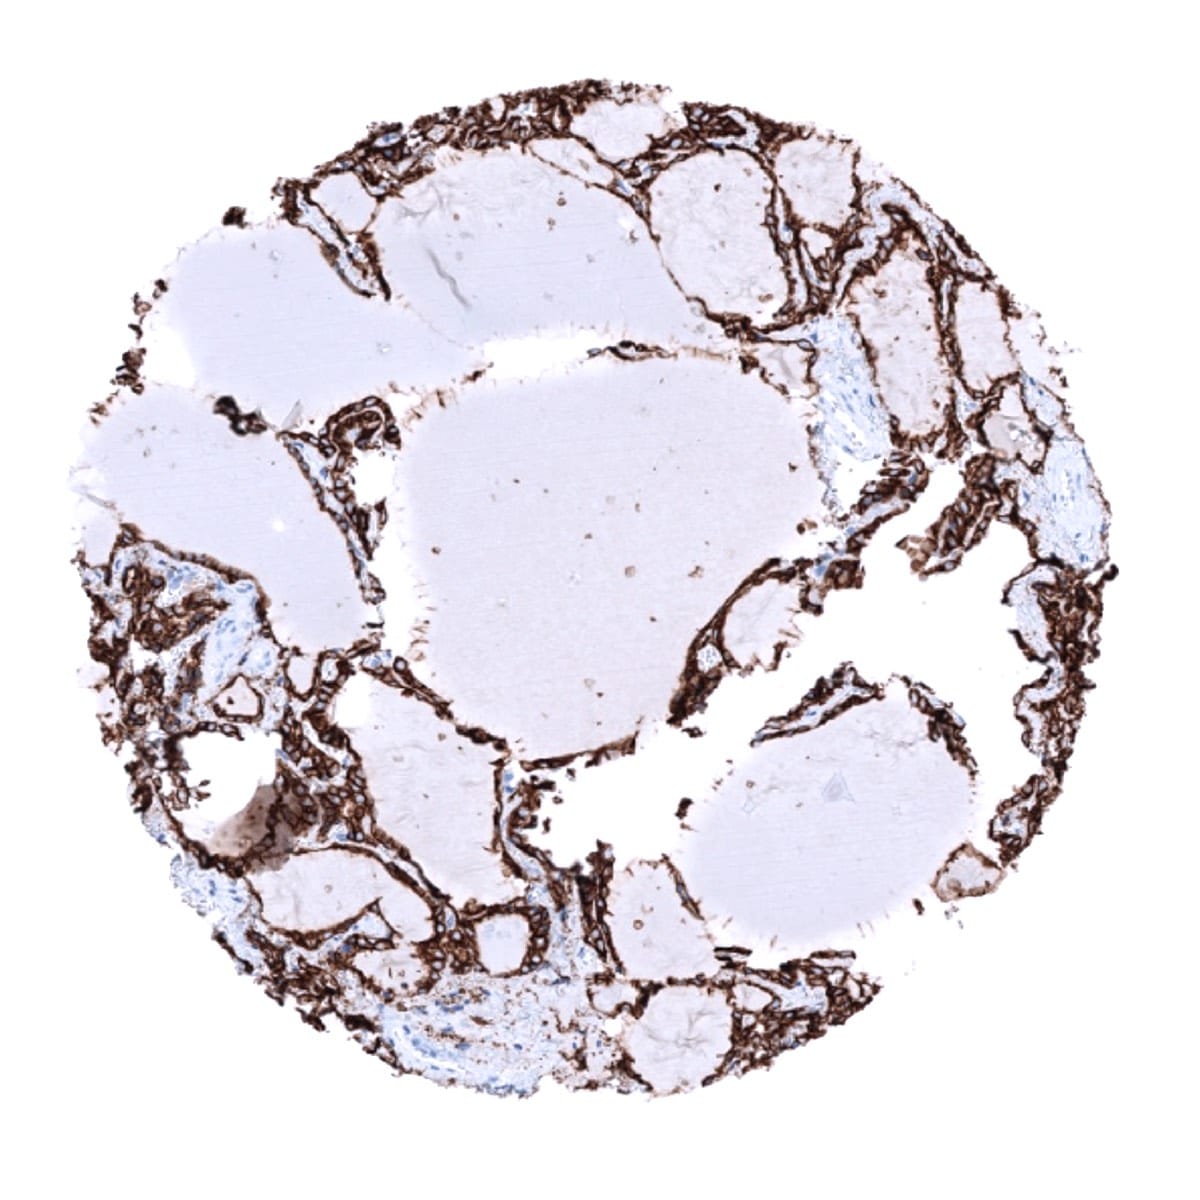
Positive control = Kidney: In kidney, distal tubule cells must show a strong predominantly membranous staining, while at a least moderate predominantly basolateral staining must be seen in the majority of proximal tubules cells and in scattered epithelial cells lining the Bowman capsule.
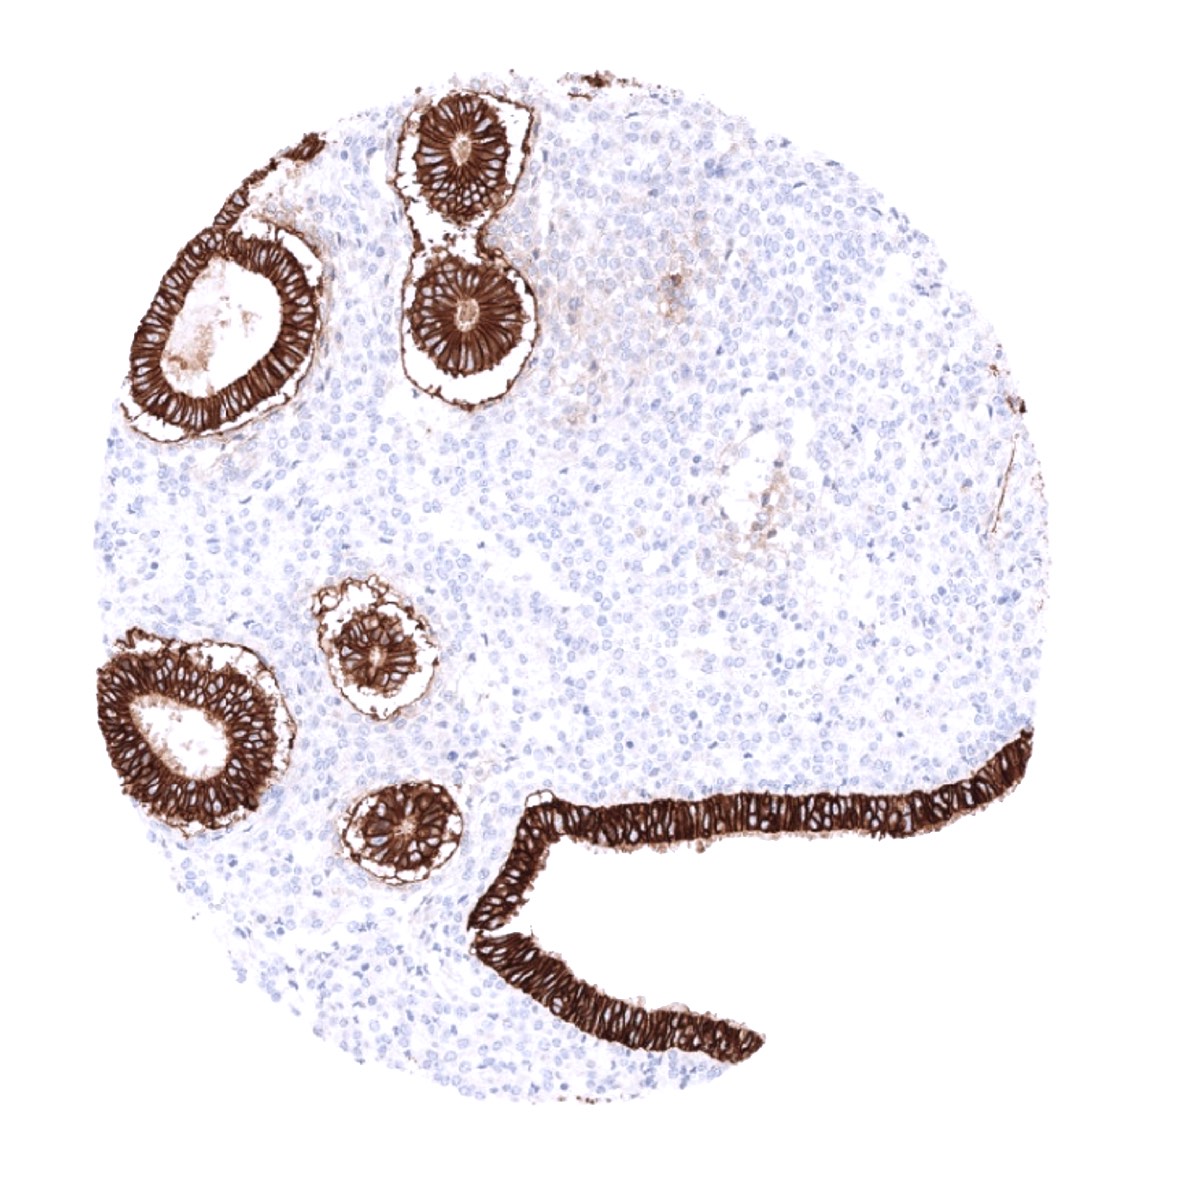
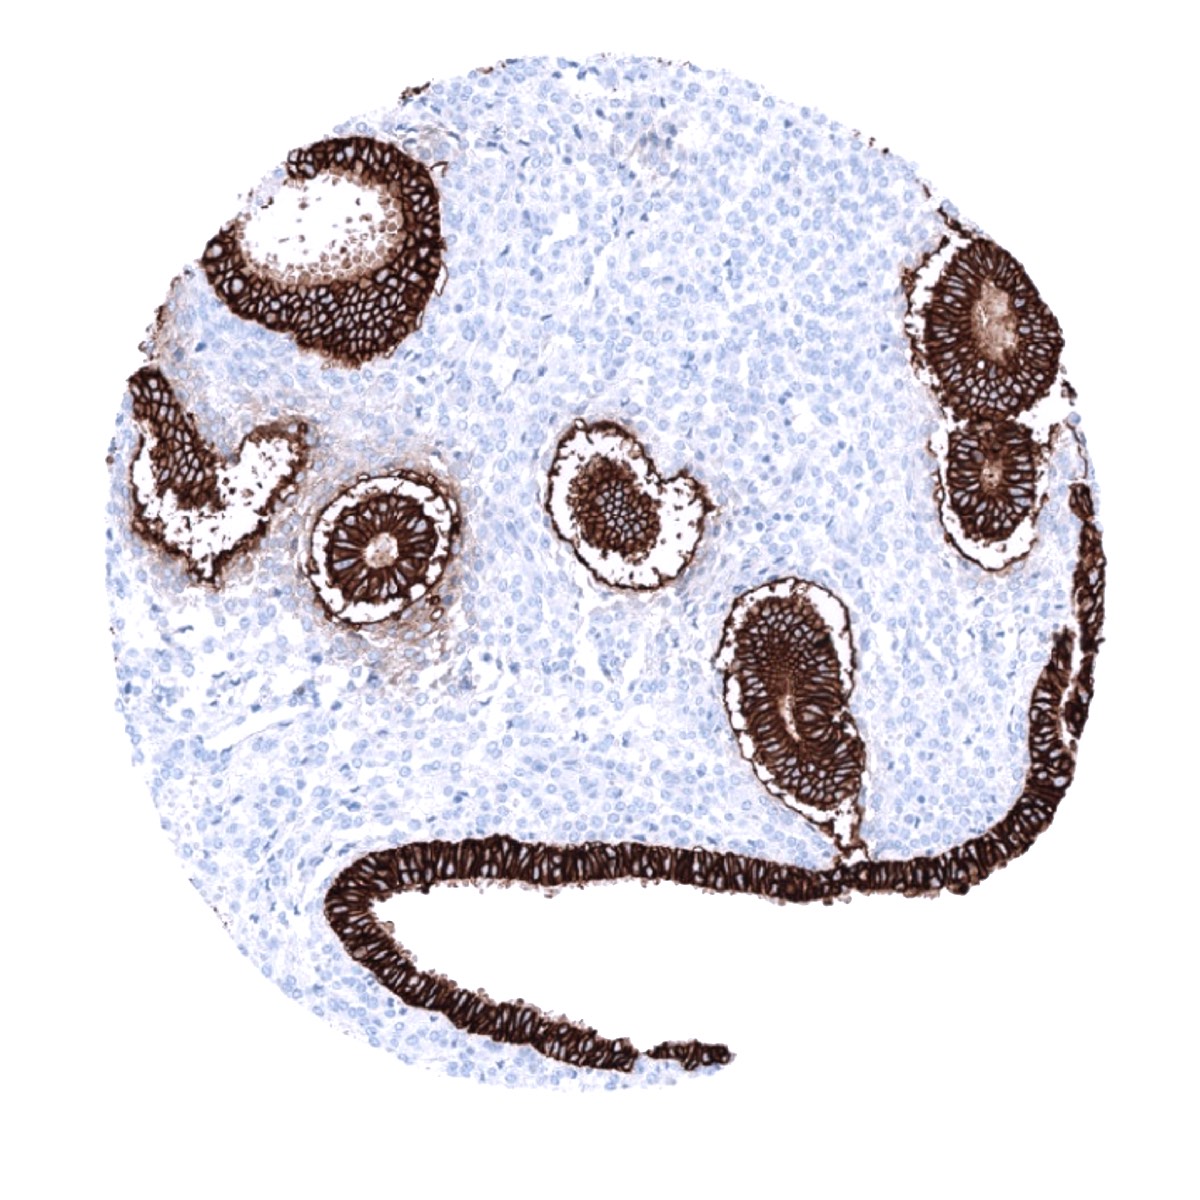
Negative control = Tonsil: EpCAM staining should be absent in lymphocytes or smooth muscle cells of the vessels.
Cellular localization = Cell Surface & Cytoplasmic
Reactivity = Human
Application = Immunohistochemistry
Dilution = 1:100-200
Intended Use = Research Use Only
Relevance of Antibody
EpCAM is expressed in a broad range of normal and neoplastic epithelial cells.
Biology Behind
Epithelial cell adhesion molecule (EpCAM) is a glycosylated, 30-40-kDa transmembrane glycoprotein coded by a gene at 2p21. It was initially considered a cell adhesion molecule but has only weak cell-adhesive properties, It is involved in cell signaling and may thus play a role in migration, proliferation, differentiation, and epithelial-mesenchymal transformation. EpCAM signaling is partly due to protein cleavage by regulated intramembrane proteolysis (RIP). EpCAM cleavage results in the release of the extracellular domain (EpEX) into the area surrounding the cell, and of the intracellular domain (EpICD) into the cytoplasm of the cell. EpICD forms a complex with the proteins β-catenin, FHL2, and Lef inside the nucleus which then binds to DNA and promotes the transcription of c-myc, cyclins A & E, and other genes. The release of cleaved EpEX can stimulate the cleavage of additional EpCAM molecules resulting in a positive feedback loop. Active proliferation in a number of epithelial tissues is associated with increased or de novo EpCAM expression. This is especially evident in tissues that normally reveal no or low levels of EpCAM expression, such as squamous epithelium or hepatocytes. The level of EpCAM expression correlates with the proliferative activity of intestinal cells, and inversely correlates with their differentiation. Deletion of a portion of the 3′ end of the EpCAM gene can indirectly cause Lynch syndrome as it causes epigenetic inactivation of the MSH2 gene by hypermethylating the promoter region of the MSH2 gene.
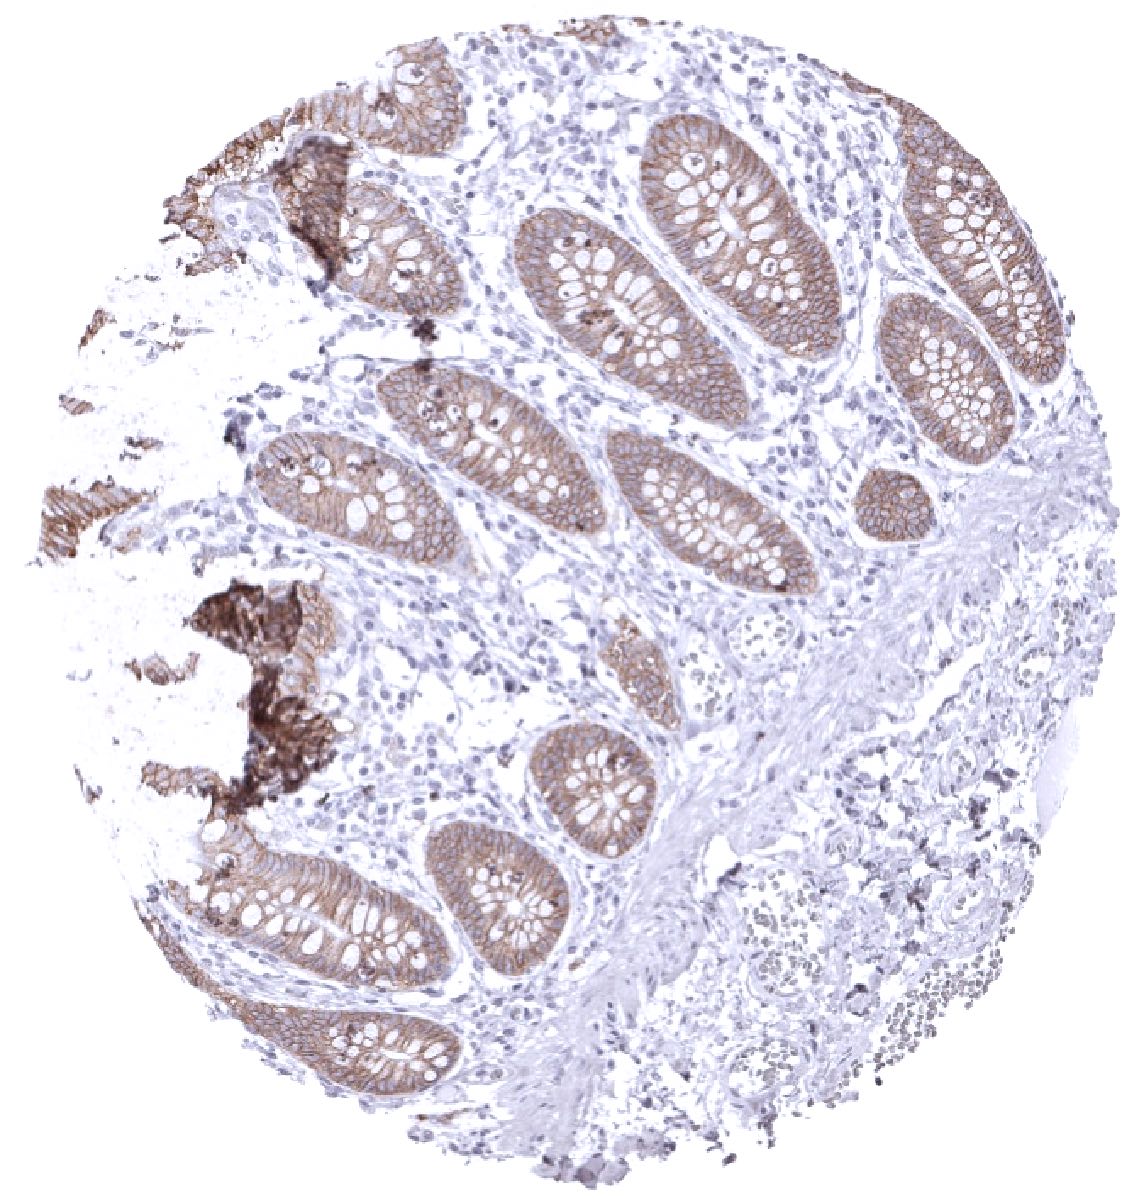
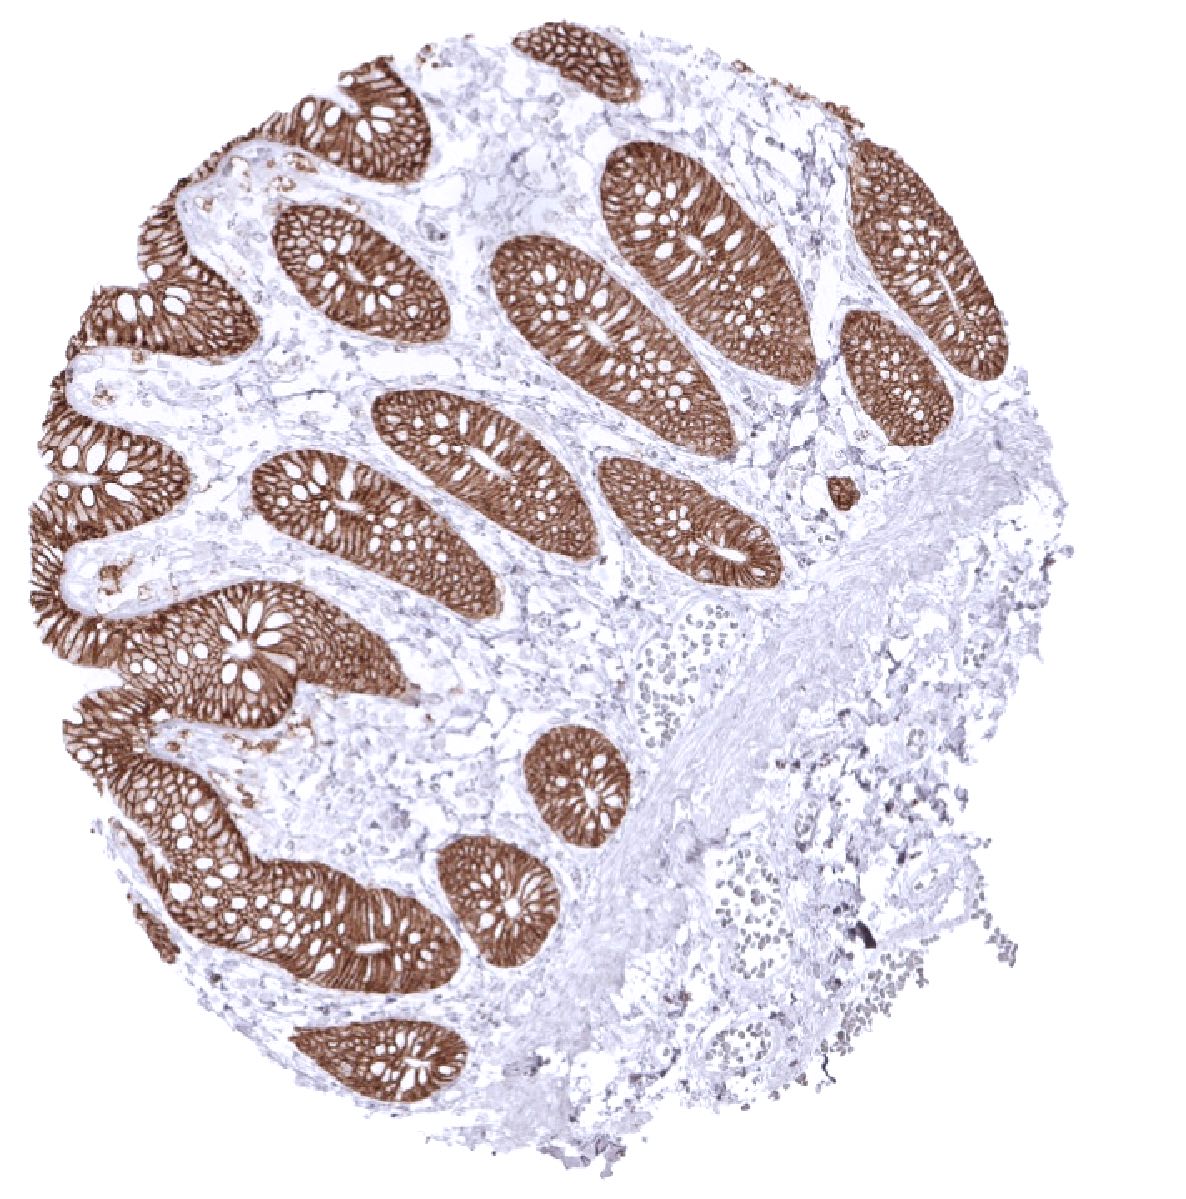
Staining Pattern in Normal Tissues
In squamous epithelia, EpCAM is variably expressed. If present, EpCAM is most strongly expressed in basal cell layers and expression can expand up to the upper third. Some squamous epithelia show few scattered EpCAM positive cells of upper layers. In the skin, EpCAM is expressed in peripheral germinative cells of sebaceous glands, ekkrine gland+, and in root sheaths of hair follicles++. Urothelium stains strongly, but sometimes weaker in umbrella cells. Scattered epithelial cells in tonsil crypts show a strong staining. Most thymus epithelial cells including corpuscles of Hassall’s weak show a weak to moderate EpCAM positivity. EpCAM is strongly expressed in all epithelial cells of the gastrointestinal tract (except parietal cells of the stomach which show a weaker staining limited to the basolateral membranes), all epithelial cells of the gallbladder and bile ducts of the liver, pancreas, salivary glands, Brunner glands, prostate, seminal vesicle, epididymis, respiratory epithelium, lung (weak to moderate intensity), endocervix, endometrium, fallopian tube, thyroid, parathyroid, and the adenohypophysis. In the kidney, a strong staining is seen in the distal tubuli while staining is less intense and focussed to the basolateral membranes in the majority of proximal tubulus cells. Scattered epithelial cells lining the Bowman capsule are also positive. In the breast gland, luminal cells are strongly positive but myoepithelial cells show much less or absent staining. In the testis, spermatogonia and spermatocytes stain strongly but Sertoli and Leydig cells are negative. In the adrenal gland a weak membranous staining of adrenocortical cells can be seen. In the first trimenon placenta only the cytotrophoblast shows a weak to moderate staining. In the mature placenta, a weak membranous staining of the basal membrane of the trophoblast layer is occasionally seen. EpCAM staining is weak in amnion cells and moderate in chorion cells. EpCAM staining is absent in aorta and other blood vessels, muscle, fat, lymph node, spleen, hepatocytes, neurohypophysis and the brain. Normal mesothelial cells are EpCAM negative, but may express focal reaction when undergoing reactive changes.
These findings are largely consistent with the RNA and protein data described in the Human Protein Atlas (Tissue expression EpCAM)
Positive control: Kidney: In kidney, distal tubule cells must show a strong predominantly membranous staining, while at a least moderate predominantly basolateral staining must be seen in the majority of proximal tubules cells and in scattered epithelial cells lining the Bowman capsule.
Negative control: Tonsil: EpCAM staining should be absent in lymphocytes or smooth muscle cells of the vessels.
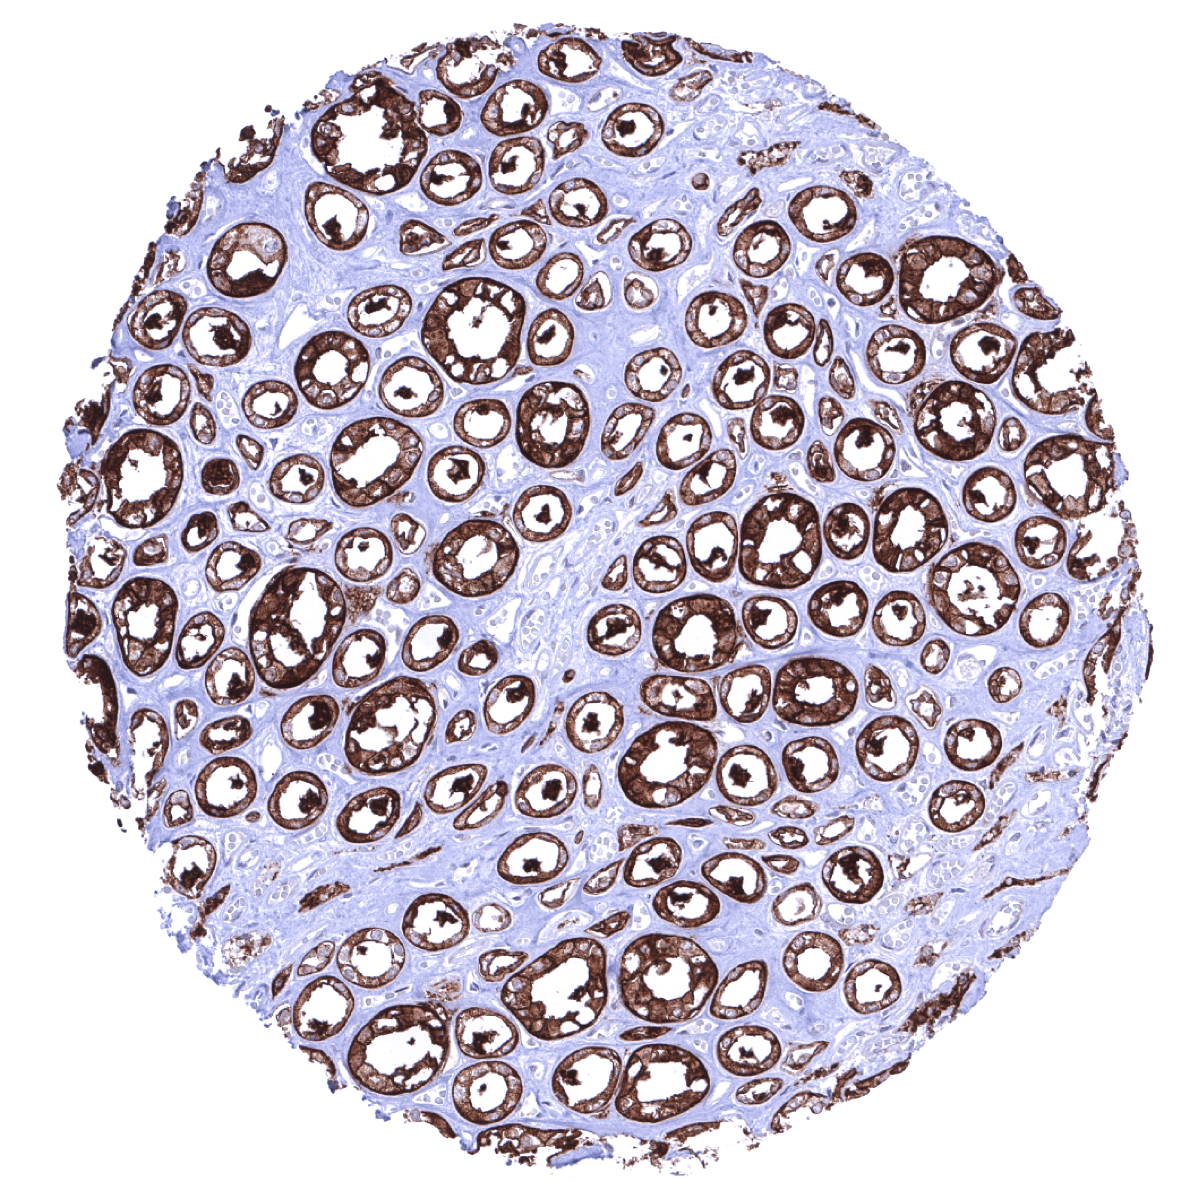

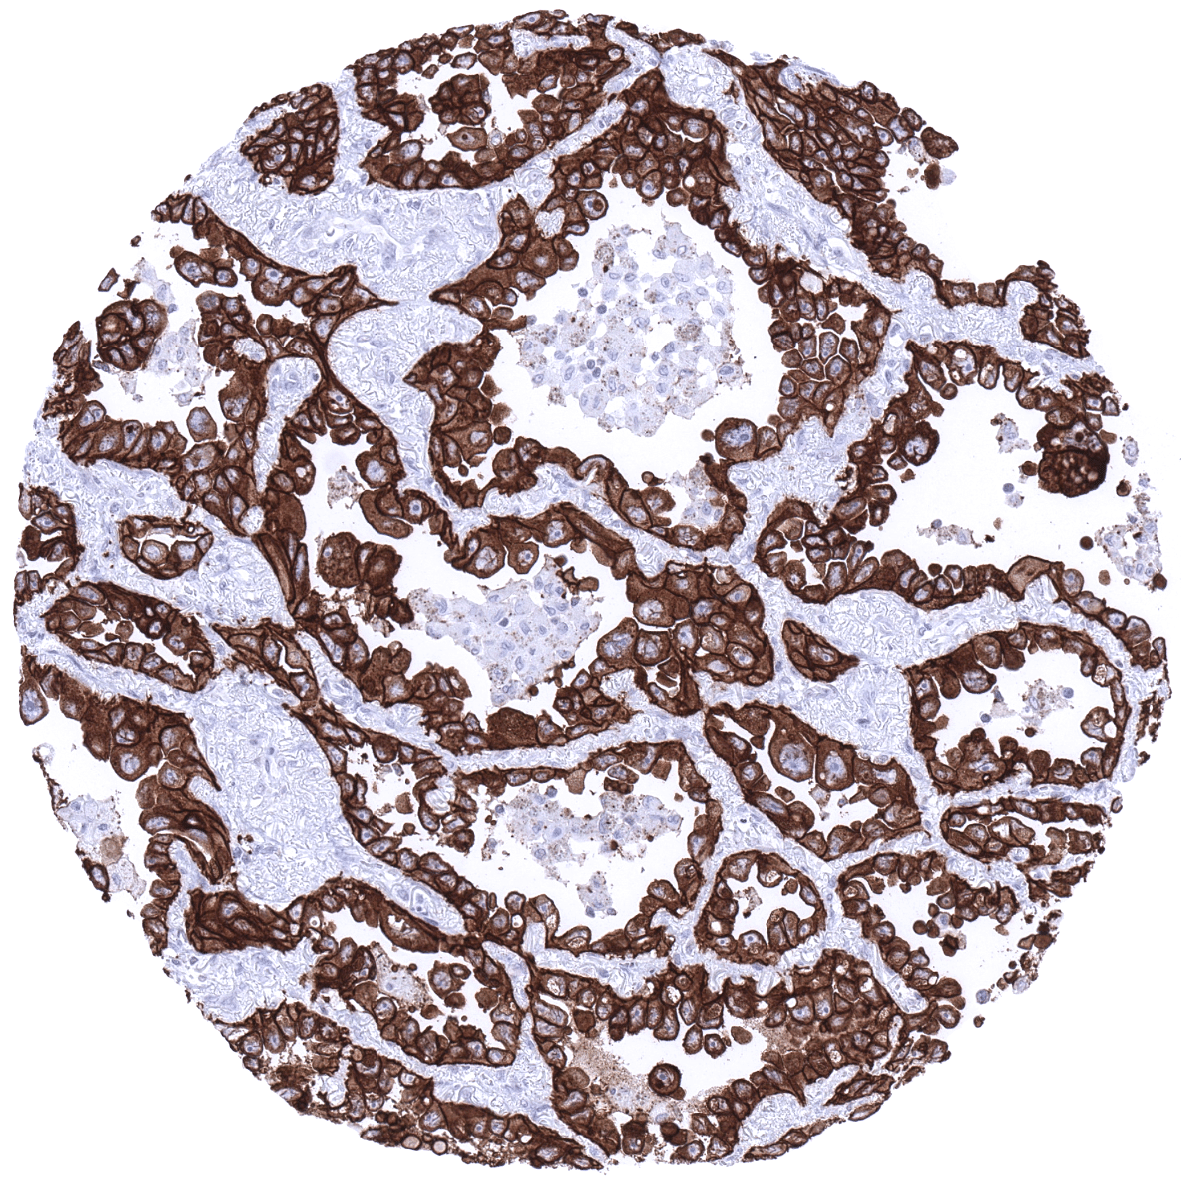
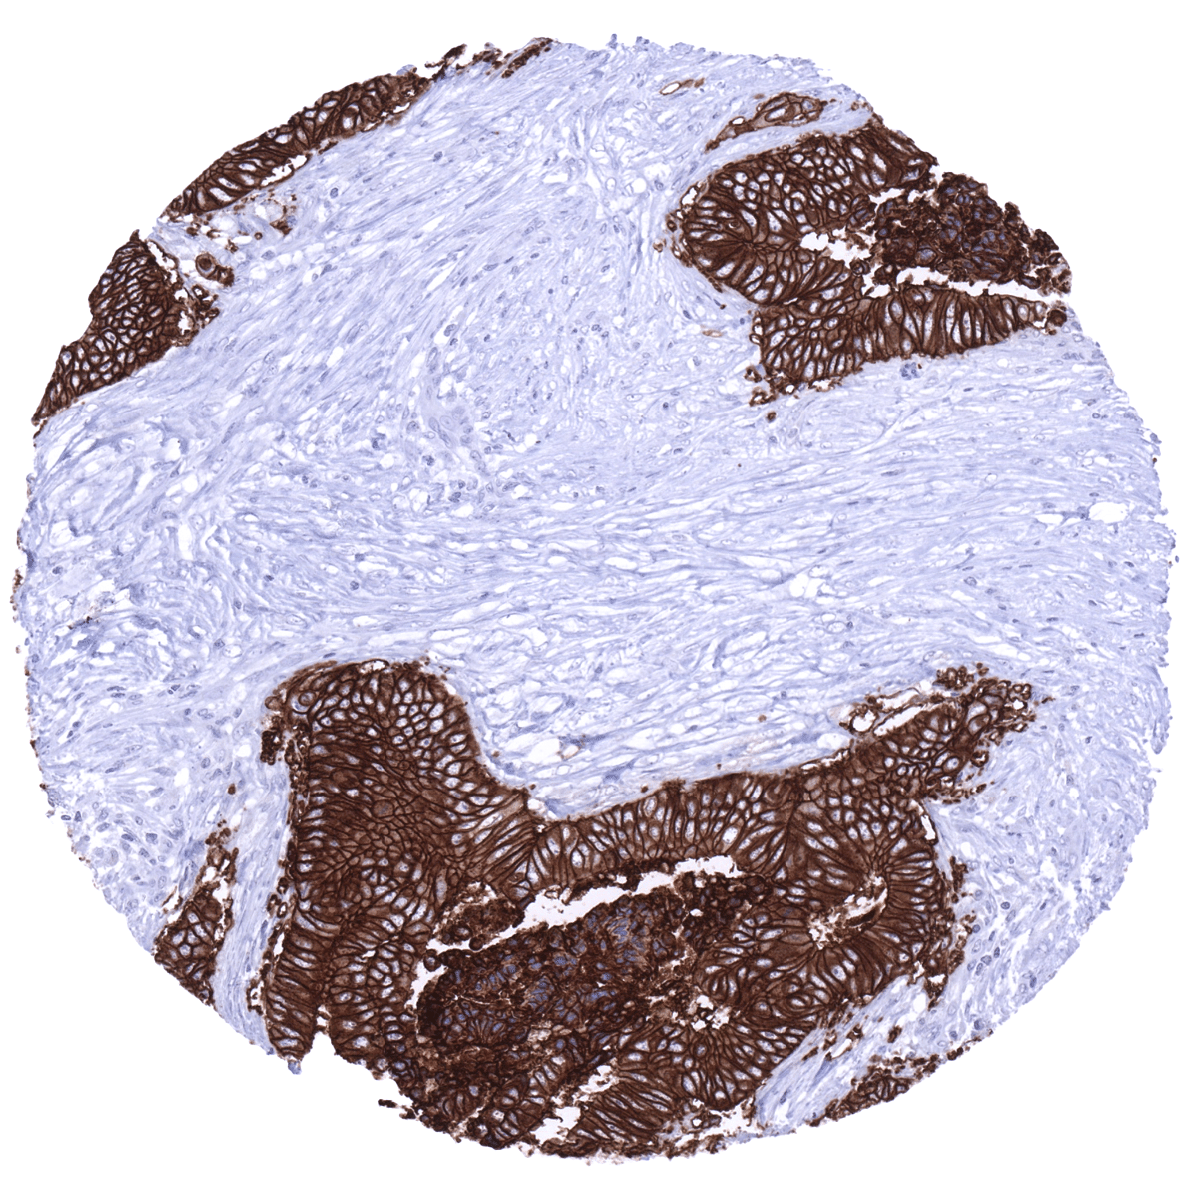
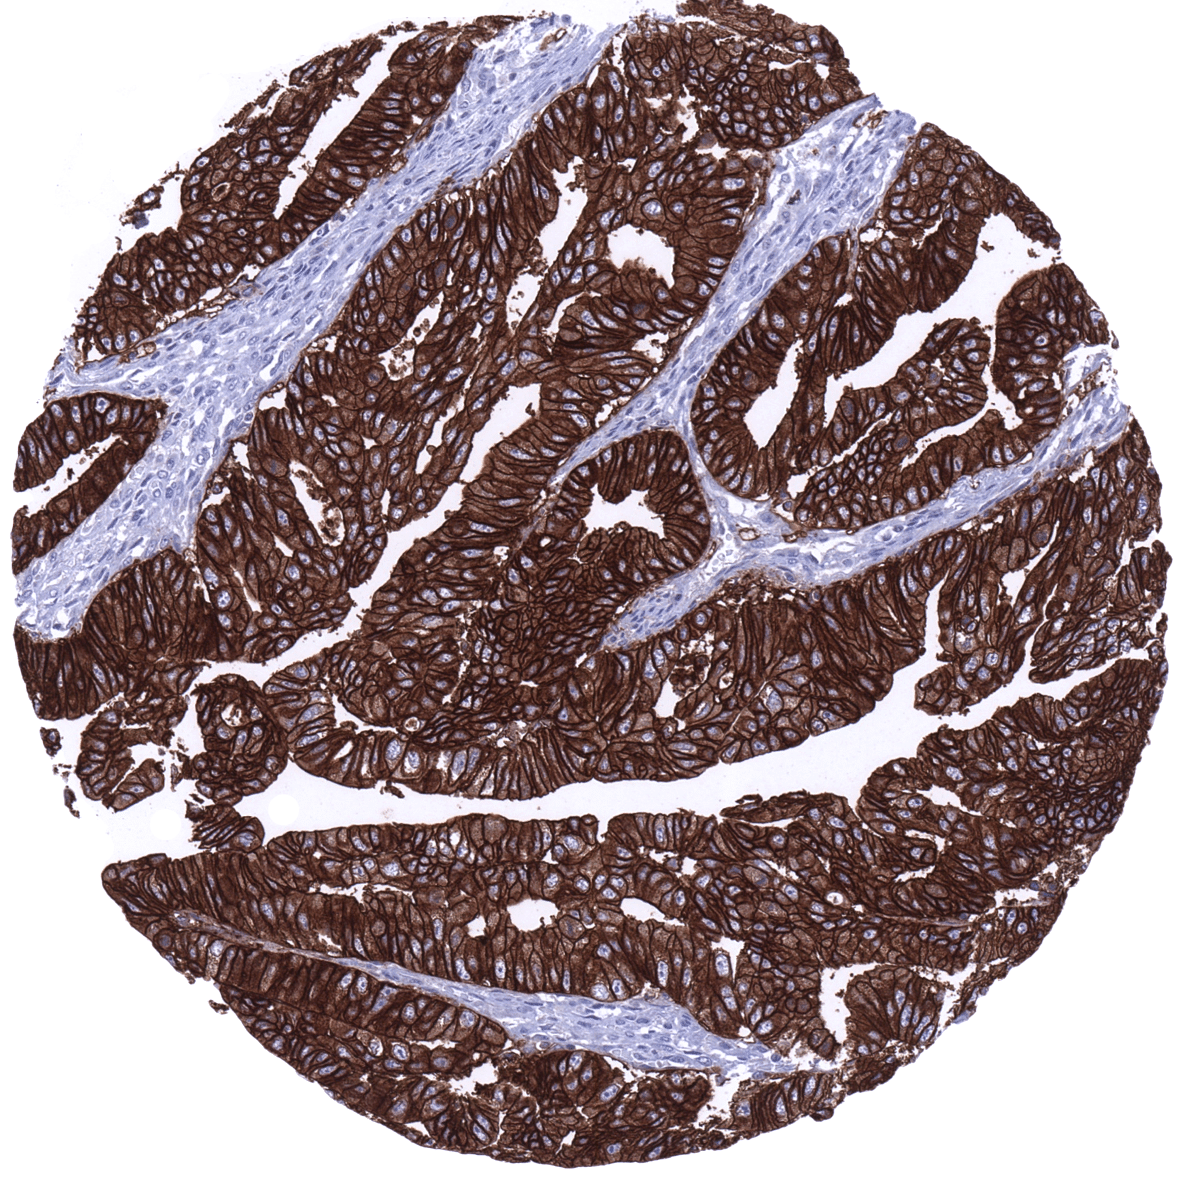
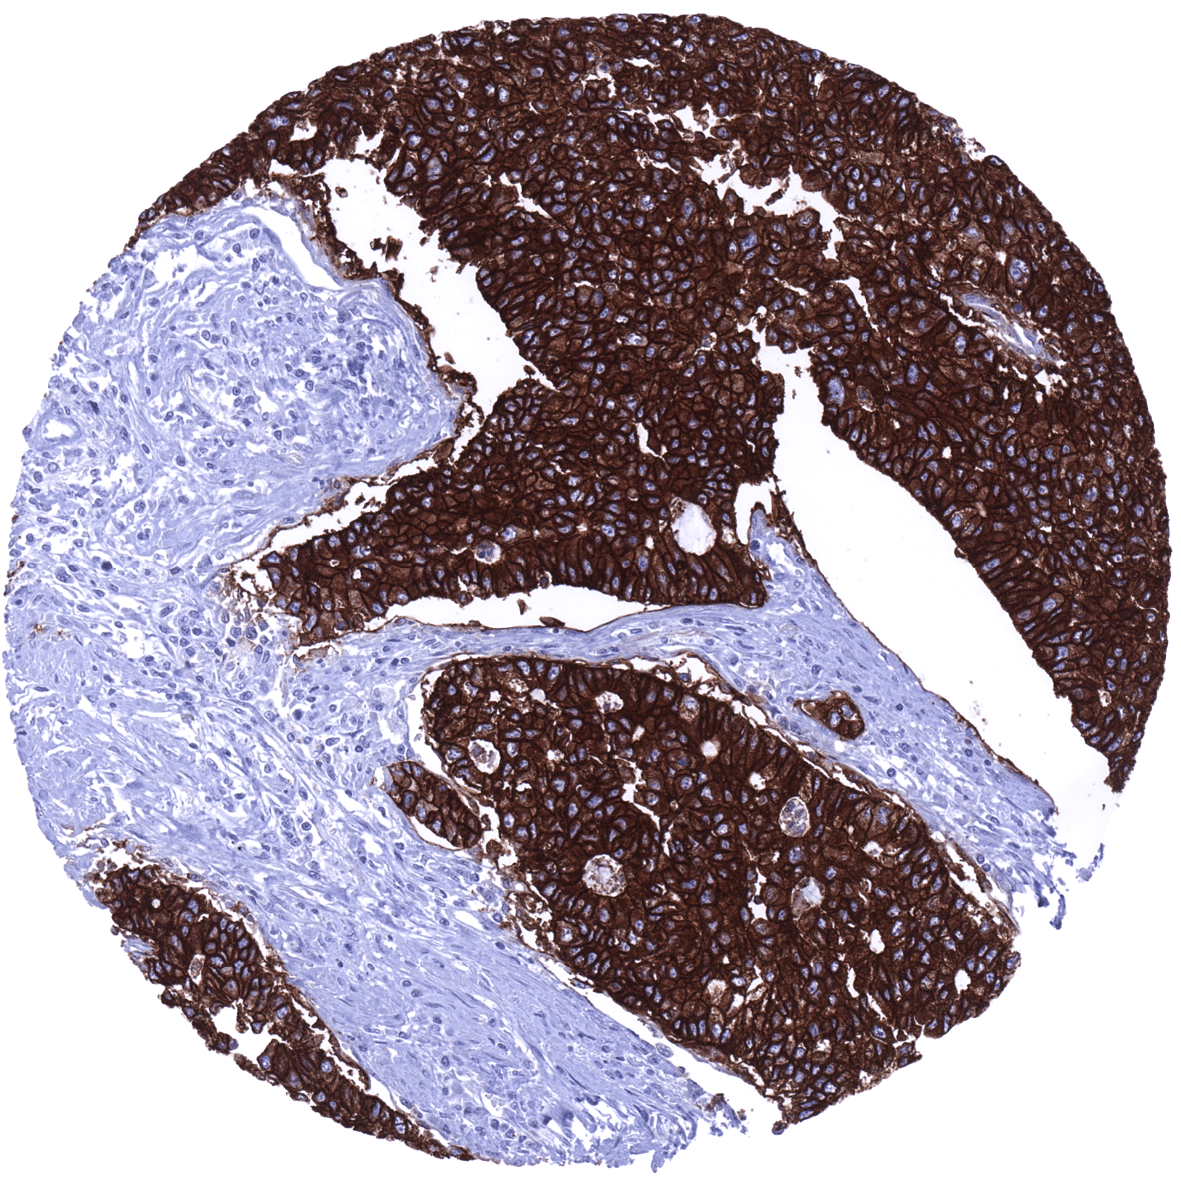
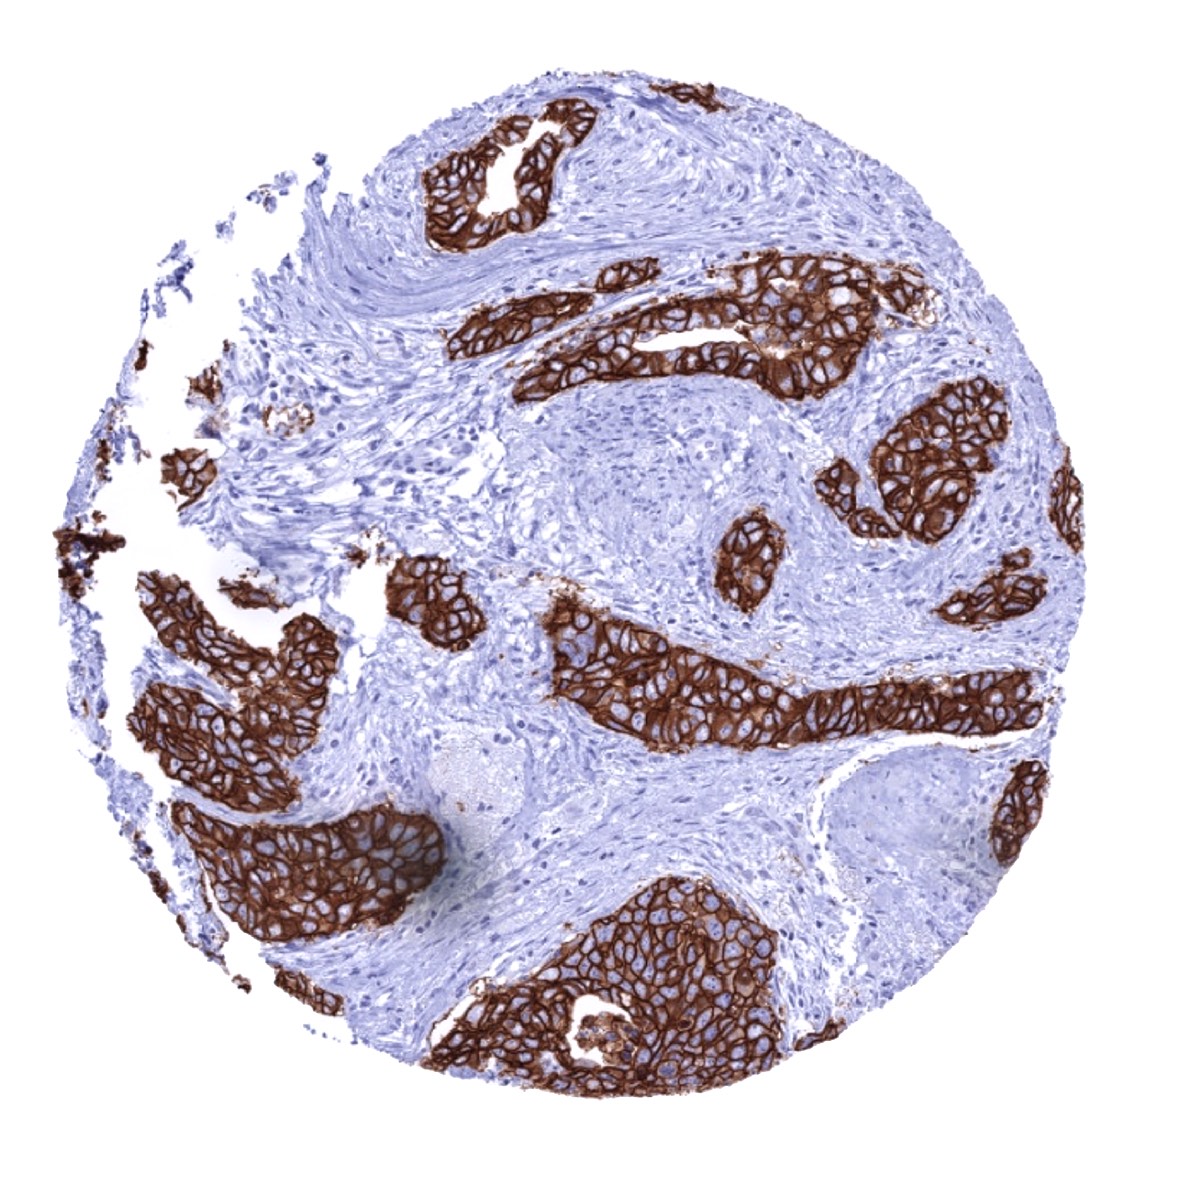
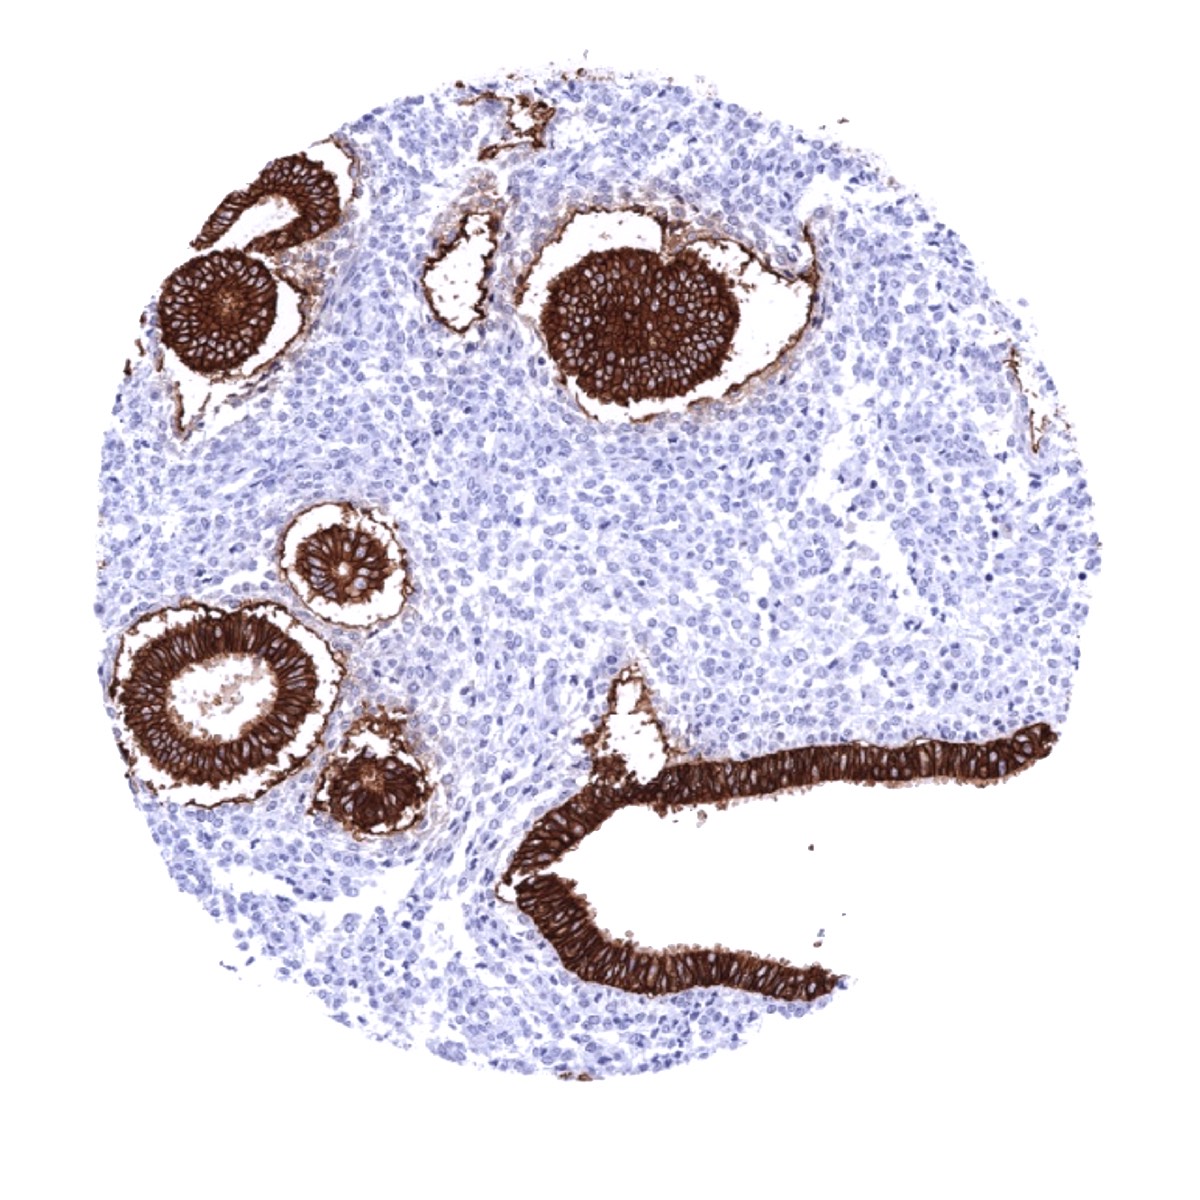
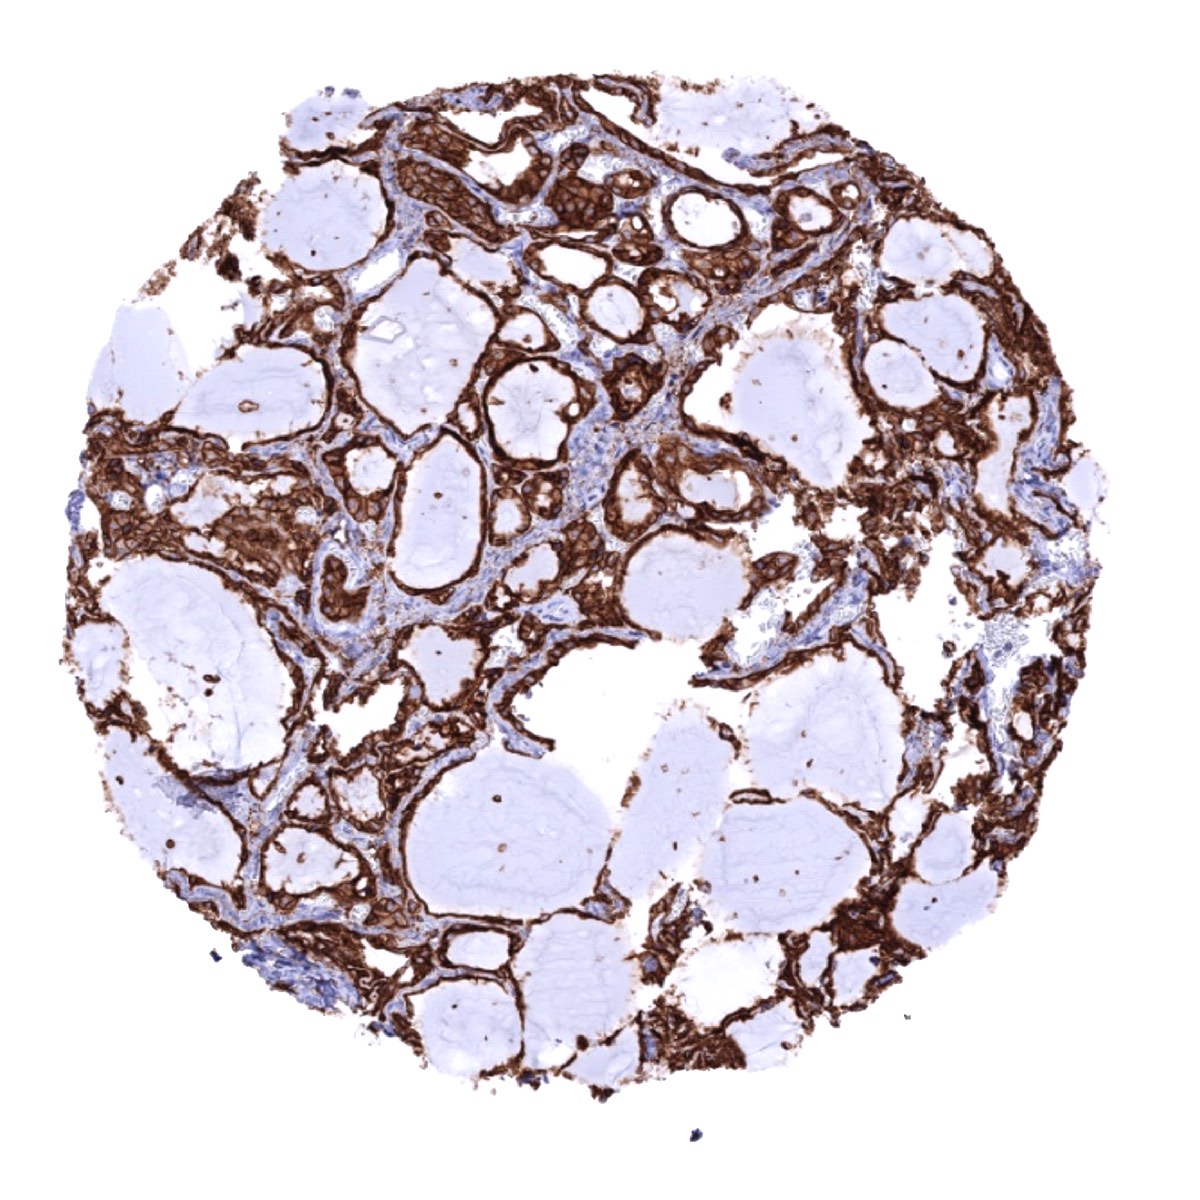
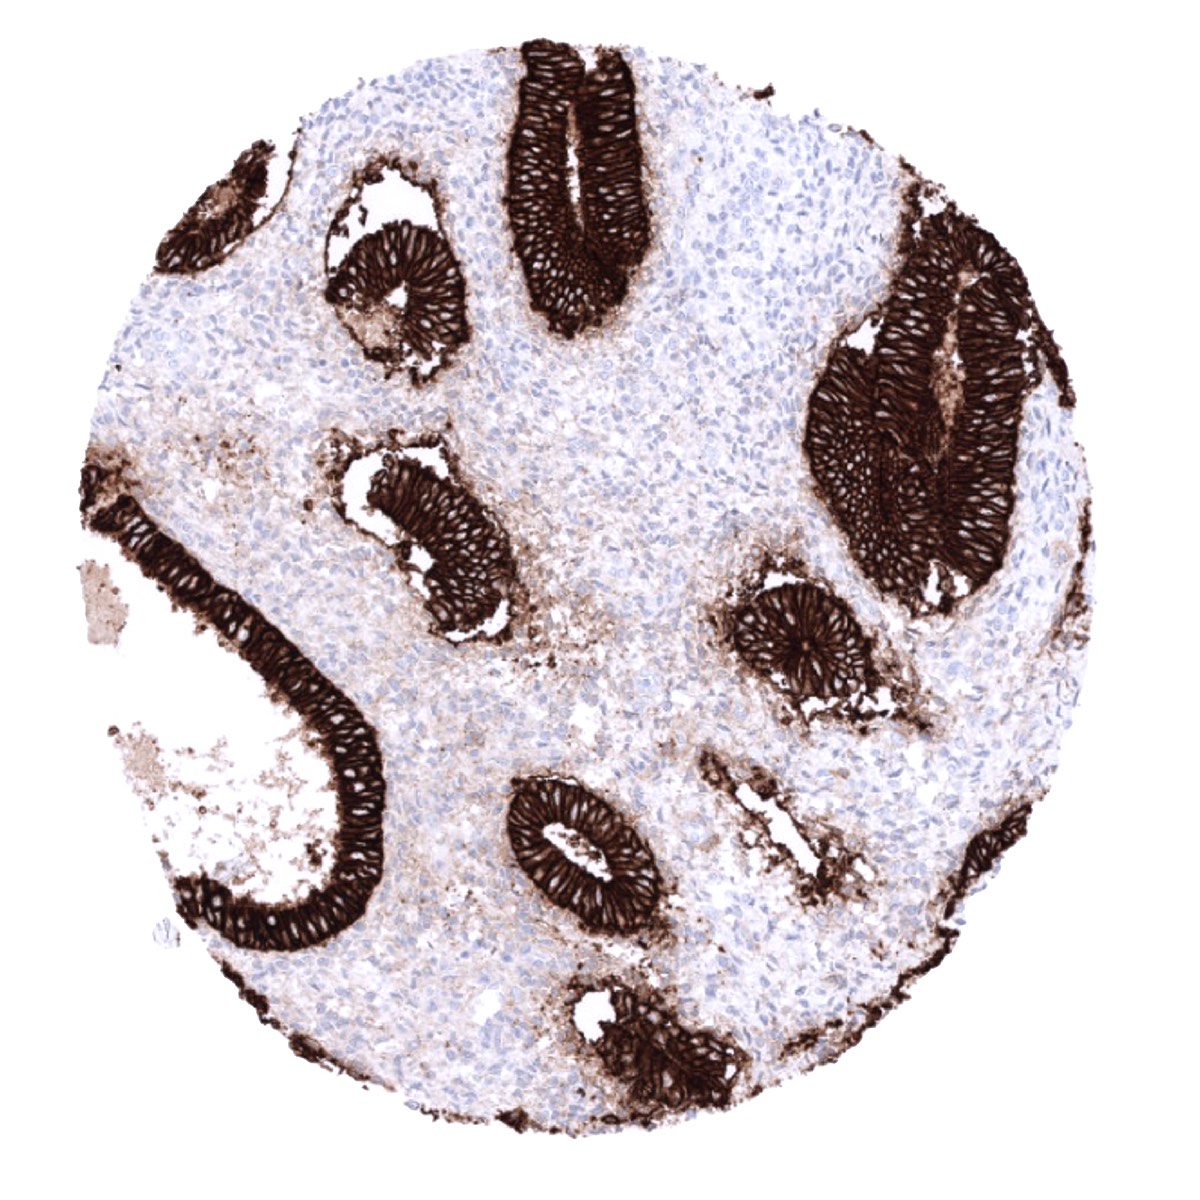
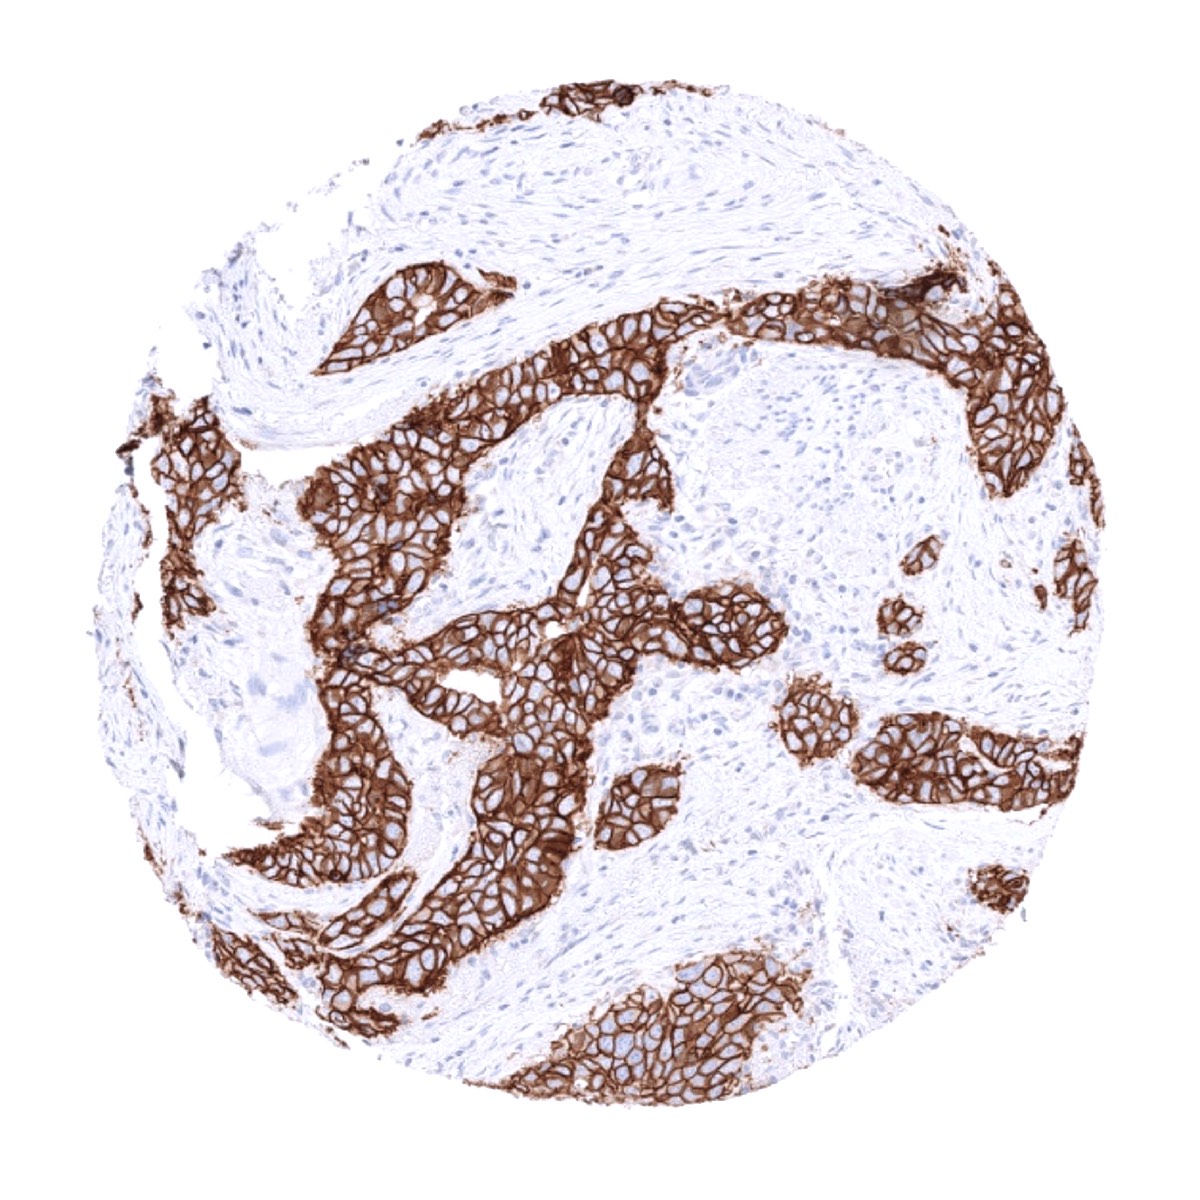
Staining Pattern in Relevant Tumor Types
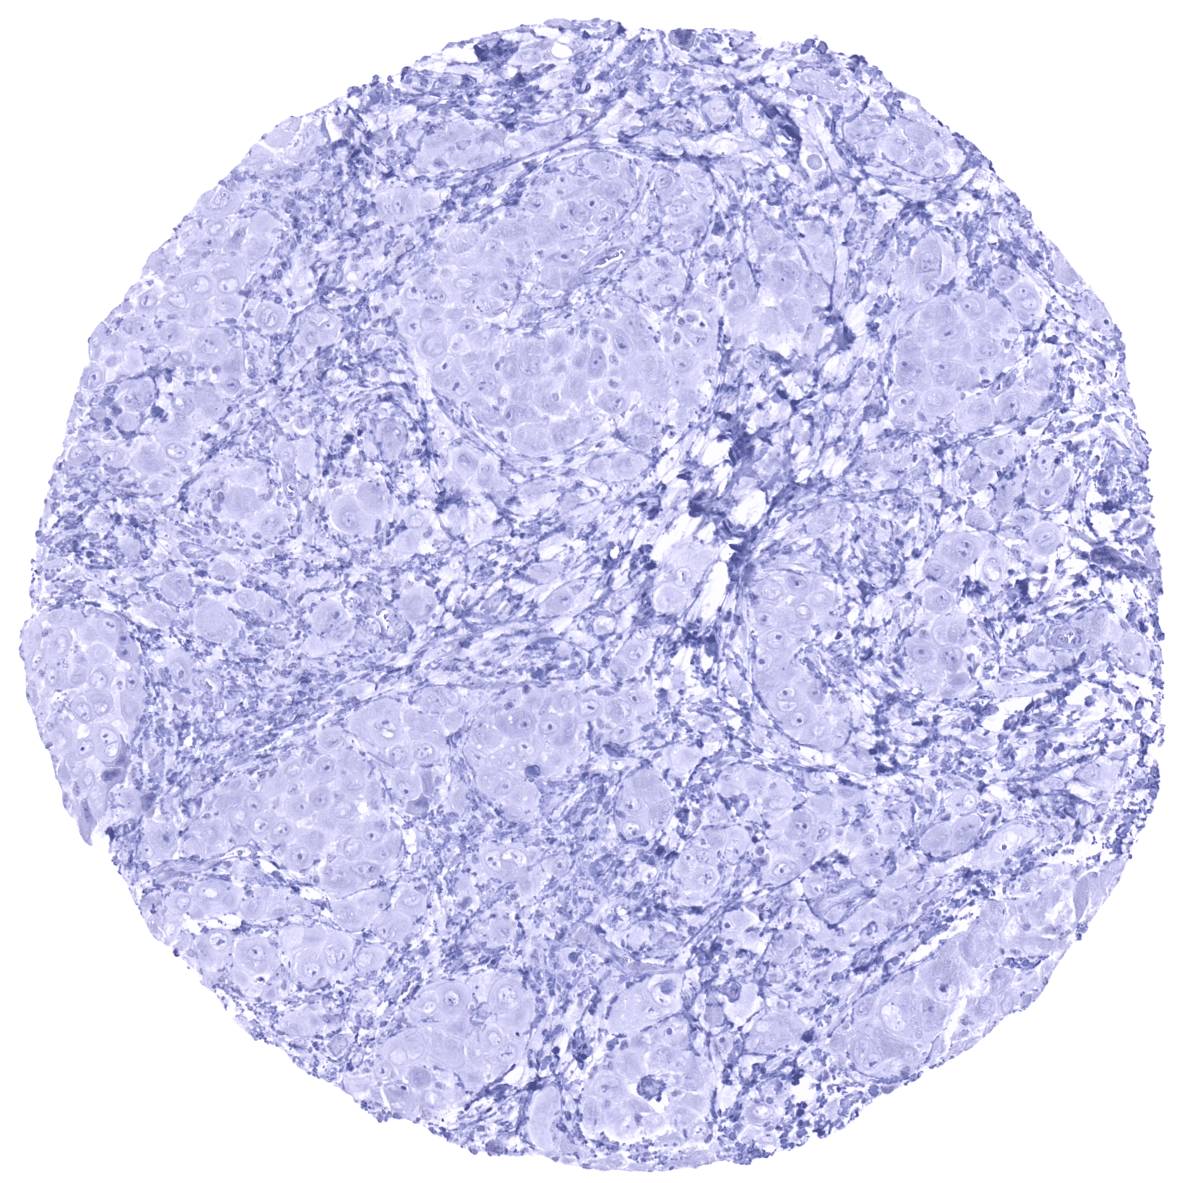
EpCAM staining occurs in most epithelial tumors. Tumors that are usually EpCAM negative include hepatocellular carcinoma and adrenocortical tumors. Tumors that are EpCAM negative in a large fraction of cases include squamous cell carcinomas and epitheloid mesotheliomas. Mesenchymal tumors and tumor components are almost always EpCAM negative.
The TCGA findings on EpCAM RNA expression in different tumor categories have been summarized in the Human Protein Atlas.
Compatibility of Antibodies
EpCAM (MSVA-326R) publication summary
Relevant publication: Menz et al. “Epithelial Cell Adhesion Molecule (EpCAM) Expression in Human Tumors: A Comparison with Pan-Cytokeratinand TROP2 in 14,832 Tumors” Published in Diagnostics (Basel) 2024 May; 14(10): 1044. PMID: 38786342
A total of 12,780 tumors from 120 different tumor categories were successfully analyzed by using the following protocol: Heat-induced antigen retrieval for 5 minutes in an autoclave at 121°C in pH 9,0 Target Retrieval Solution buffer. MSVA-326R, at a dilution of 1:150 at 37°C for 60 minutes. Visualization of bound antibody by the EnVision Kit (Dako, Agilent). This protocol was also used for all stainings depicted in our tumor and normal tissue galleries.
Overall, 99 of 120 tumor categories showed detectable EpCAM staining with 85 tumor categories showing at least one strongly positive case. EpCAM positivity predominated in (but was not restricted to) epithelial tumors. The positivity rate was highest in adenocarcinomas, neuroendocrine neoplasms (including small cell carcinomas), and germ cell tumors. The total rate of positivity and the fraction of strongly positive tumors tended to be lower in urothelial neoplasms and in squamous cell carcinomas. Among epithelial neoplasms, the lowest rates of positive and strongly positive cases occurred in hepatocellular carcinomas, adrenocortical tumors, renal cell neoplasms, and in carcinomas with a particularly poor differentiation such as sarcomatoid urothelial carcinomas and anaplastic carcinomas of the thyroid. The distribution of positive staining results is shown in an “organ-systematic” (Figure 1) and in a “ranking order” figure (Figure 2) below (images based on data from Menz et al). Data on associations with histopathological and clinical parameters are also summarized below (Table 3; based on data described by Menz et al).
Authors conclusions on diagnostic utility of EpCAM IHC with respect to the distinction of different tumor entities (Menz et al.):
- EpCAM is a “surrogate pan-epithelial marker” in case of adenocarcinomas.
- EpCAM IHC can be used for the identification of circulating adenocarcinoma cells given the close to 100% EpCAM positivity rate of these cancers.
- The particularly low rate of EpCAM positivity in mesotheliomas (26%) and hepatocellular carcinomas (14.3%) may assist in the distinction of these tumors from other entities which are much more commonly EpCAM positive such as adenocarcinomas and their metastases.
Authors conclusions on the prognostic role of EpCAM immunostaining results (Menz et al.):
- High EpCAM staining was linked to high grade (p < 0.0001), distant metastasis (p = 0.0006), ER/PR loss (p < 0.0001 each), and HER2 positivity (p = 0.0009) in breast cancer of no special type.
- High EpCAM staining was linked to high grade and to HPV infection in squamous cell carcinomas of different sites (p < 0.0001 each).
- Low EpCAM staining was linked to invasive disease in urothelial carcinoma (p < 0.0001).
- Low EpCAM staining was linked to high grade in clear cell renal cell carcinomas (p < 0.05).
The authors also highlight differences between EpCAM, TROP2 and CKpan immunostaining in cancer. They showed that – as compared to EpCAM – TROP2 is markedly more often expressed in squamous cell carcinomas while CKpan is less commonly positive in seminomas and neuroendocrine neoplasms.
Figure 1. EpCAM staining in cancer (“organ-systematic”; according to Menz et al.)

Figure 2. EpCAM staining in cancer (“ranking order”; according to Menz et al.)

Protocol Recommendations
IHC users have different preferences on how the stains should look like. Some prefer high staining intensity of the target stain and even accept some background. Others favor absolute specificity and lighter target stains. Factors that invariably lead to more intense staining include higher concentration of the antibody and visualization tools, longer incubation time, higher temperature during incubation, higher temperature and longer duration of the heat induced epitope retrieval (slide pretreatment). The impact of the pH during slide pretreatment has variable effects and depends on the antibody and the target protein.
All images and data shown here and in our image galleries are obtained by the manual protocol described below. Other protocols resulting in equivalent staining are described as well.
Manual protocol
Freshly cut sections should be used (less than 10 days between cutting and staining). Heat-induced antigen retrieval for 5 minutes in an autoclave at 121°C in pH 7,8 Target Retrieval Solution buffer. Apply MSVA-326R at a dilution of 1:150 at 37°C for 60 minutes.Visualization of bound antibody by the EnVision Kit (Dako, Agilent) according to the manufacturer’s directions.
Agilent / Dako – Autostainer Link 48
Pretreatment in PT-Link for 30 minutes at 95°C (pH high); FLEX peroxidase blocking for 5 minutes (room temperature), MSVA-326R 1:100 for 20 minutes (room temperature), FLEX+ mouse/rabbit (LINKER) for 15 minutes (room temperature), horseradish peroxidase (HRP) for 20 minutes (room temperature), FLEX DAB+Sub-Chromo for 10 minutes (room temperature), FLEX hematoxylin for 5 minutes (room temperature).

These images reflect stainings by the protocol described above. It is of note that a comparable staining result can also be obtained by different protocols. In general, a longer pretreatment, a longer incubation time of the primary antibody, a higher antibody concentration, and a longer incubation time of FLEX+LINKER result in stronger staining, potentially at the cost of more background staining. Modifications of the protocol with a strengthening effect on staining intensity in combination with changes of other parameters that result in lower staining intensity can result in a comparable result as shown above.
Leica – BOND RX
Dewax at 72°C for 30 seconds; Pretreatment in Bond Epitope Retrieval Solution (ER2 – EDTA pH9) for 20 minutes at 100°C; Peroxidase blocking for 5 minutes (room temperature), MSVA-326R 1:150 for 15 minutes (room temperature), Post primary (rabbit anti mouse) for 8 minutes (room temperature), Polymer (goat anti rabbit) for 8 minutes (room temperature), mixed DAB refine for 10 minutes (room temperature), hematoxylin for 5 minutes (room temperature).

These images reflect stainings by the protocol described above. It is of note that a comparable staining result can also be obtained by different protocols. In general, a longer pretreatment, a longer incubation time of the primary antibody, a higher antibody concentration, a higher temperature during incubation, and a longer incubation time of Post primary and or the Polymer result in stronger staining, potentially at the cost of more background staining. Modifications of the protocol with a strengthening effect on staining intensity in combination with changes of other parameters that result in lower staining intensity can result in a comparable result as shown above.
Roche – Ventana Discovery ULTRA
Pretreatment for 64 minutes at 100°C (pH 8,4); CM peroxidase blocking for 12 minutes (room temperature), MSVA-326R 1:150 for 20 minutes at 36°C, secondary antibody (anti-rabbit HQ) for 12 minutes at 36°C, anti-HQ HRP for 12 minutes at room temperature, DAB at room temperature, hematoxylin II at room temperature for 8 minutes, bluing reagent at room temperature for 4 minutes.

These images depict staining results obtained by the protocol described above. It is of note, that the Ventana machines generally require higher antibody concentrations than other commonly used autostainers because the antibodies are automatically diluted during the procedure. Various other protocols can result in an identical result as shown above. A longer pretreatment, a longer incubation time of the primary antibody, a higher antibody concentration, a higher temperature during incubation, and a longer incubation time of secondary antibody and or the anti-HQ HRP result in stronger staining, potentially at the cost of more background staining.
Impact of pH

MSVA-326R results in strongest staining if pH9,0 is used for slide pretreatment. pH7,8 is acceptable but lower pH results in a significant reduction of sensitivity.
Potential Research Applications
- Because of partly controversial data, the diagnostic utility of EpCam IHC should be investigated in a large cohort of tumors from different entities.
- Although the EpCam protein is known for a long time, its function is not completely understood.
- Multicolor immunohistochemistry could shed some light on EpCAM signaling effects.
- Whether or not EpCAM expression levels influence cancer prognosis is unclear
Evidence for Antibody Specificity in IHC
The data demonstrated on this homepage on the expression pattern of EpCAM in normal tissues largely matches the data presented on the Human Protein Atlas (Tissue expression EpCAM) although some RNA expression data derived three independent RNA screening studies, including the Human Protein Atlas (HPA) RNA-seq tissue dataset, the FANTOM5 project, and the Genotype-Tissue Expression (GTEx) project do not suggest a major EpCAM expression in several tissues where we see strong EpCAM staining. These especially include organs of the female genital tract. Positively staining epithelial structures in these tissues may constitute too small subsets of the total amount of cells to be properly represented in RNA analyses. The protein data described in the protein atlas are in better agreement with our findings but the sensitivity of the protein atlas assays has been designed to be lower than for our recommended protocol for MSVA-326R.
